Area Overview for SL7 3AL
Photos of SL7 3AL
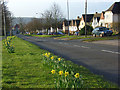
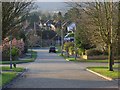
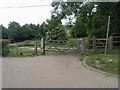
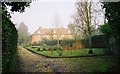
21 photos from this area
Area Information
Key information about the SL7 3AL including its size, population, and administrative classification.
- Area Type
- Postcode
- Area Size
- 2.3 hectares
- Population
- 1758
- Population Density
- 4384 people/km²
House Prices in SL7 3AL
38
Properties
£433,674
Average Sold Price
£124,000
Lowest Price
£995,000
Highest Price
Showing 38 properties
| Address | Type | Beds | Baths | Last Sale Price | Last Sale Date | |
|---|---|---|---|---|---|---|
| 21 Trinity Avenue, Marlow, SL7 3AL | Terraced | 5 | 2 | £995,000 | Jul 2025 | |
| 26 Trinity Avenue, Marlow, SL7 3AL | Terraced | 3 | 1 | £575,000 | Apr 2024 | |
| 17 Trinity Avenue, Marlow, SL7 3AL | Terraced | 3 | 1 | £500,000 | Jul 2023 | |
| 28 Trinity Avenue, Marlow, SL7 3AL | Retail | 3 | 1 | £550,000 | Oct 2022 | |
| 14 Trinity Avenue, Marlow, SL7 3AL | Retail | 3 | 1 | £732,000 | Oct 2022 | |
| 11 Trinity Avenue, Marlow, SL7 3AL | Semi-detached | 4 | 1 | £585,000 | Feb 2021 | |
| 12 Trinity Avenue, Marlow, SL7 3AL | house | - | - | £420,000 | Jan 2020 | |
| 34 Trinity Avenue, Marlow, SL7 3AL | Terraced | - | - | £402,000 | Jul 2019 | |
| 1 Trinity Avenue, Marlow, SL7 3AL | Semi-detached | 4 | - | £460,000 | Jan 2016 | |
| 37 Trinity Avenue, Marlow, SL7 3AL | Terraced | 4 | - | £458,500 | May 2015 |
Page 1 of 4
Energy Efficiency in SL7 3AL
Amenities
Schools
| Rank | School | Type | Entry gender | Ages |
|---|
Explore more schools in this area
Go to Schools tabDemographics
Household Size
One person
most common
Accommodation Type
Houses
most common
Tenure
48
majority
Ethnic Group
White
most common
Religion
N/A
most common
Household Composition
N/A
most common
Age
47
median
Adults (30-64 years)
most common
Household Deprivation
N/A
with no deprivation
NS-SEC
40
in Lower managerial occupations
Explore more demographic insights in this area
Go to Demographics tabPlanning
Planning Constraints
- Flood RiskPremium
- Ramsar Wetland SitesPremium
- Area of Outstanding Natural BeautyPremium
- Protected Nature ReservePremium
- Protected WoodlandPremium