Area Overview for PO11 9NP
Photos of PO11 9NP
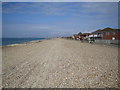
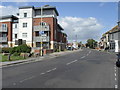
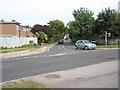
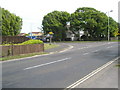
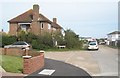
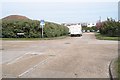
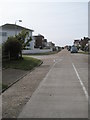
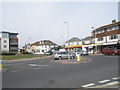
100 photos from this area
Area Information
Key information about the PO11 9NP including its size, population, and administrative classification.
- Area Type
- Postcode
- Area Size
- 1.4 hectares
- Population
- 1532
- Population Density
- 3022 people/km²
House Prices in PO11 9NP
25
Properties
£263,081
Average Sold Price
£112,500
Lowest Price
£480,000
Highest Price
Showing 25 properties
| Address | Type | Beds | Baths | Last Sale Price | Last Sale Date | |
|---|---|---|---|---|---|---|
| 6 Fishery Lane, Hayling Island, PO11 9NP | Bungalow | 4 | 2 | £480,000 | Dec 2023 | |
| 8 Fishery Lane, Hayling Island, PO11 9NP | Bungalow | 3 | 1 | £366,000 | Dec 2023 | |
| 1 Fishery Lane, Hayling Island, PO11 9NP | Semi-detached | 3 | 1 | £362,000 | Apr 2023 | |
| 10 Fishery Lane, Hayling Island, PO11 9NP | Bungalow | 3 | 1 | £280,000 | Jul 2016 | |
| 15 Fishery Lane, Hayling Island, PO11 9NP | Bungalow | 4 | 2 | £375,000 | Dec 2015 | |
| 18 Fishery Lane, Hayling Island, PO11 9NP | Semi-detached | 4 | 2 | £278,000 | Jul 2015 | |
| 14 Fishery Lane, Hayling Island, PO11 9NP | Semi-detached | 3 | - | £277,000 | Apr 2015 | |
| 26 Fishery Lane, Hayling Island, PO11 9NP | Semi-detached | 3 | - | £183,000 | Nov 2014 | |
| 12 Fishery Lane, Hayling Island, PO11 9NP | Detached | 4 | 2 | £247,000 | May 2014 | |
| 16 Fishery Lane, Hayling Island, PO11 9NP | house | 3 | - | £235,000 | Mar 2011 |
Page 1 of 3
Energy Efficiency in PO11 9NP
Amenities
Schools
| Rank | School | Type | Entry gender | Ages |
|---|
Explore more schools in this area
Go to Schools tabDemographics
Household Size
Two person
most common
Accommodation Type
Houses
most common
Tenure
79
majority
Ethnic Group
White
most common
Religion
N/A
most common
Household Composition
N/A
most common
Age
47
median
Adults (30-64 years)
most common
Household Deprivation
N/A
with no deprivation
NS-SEC
31
in Lower managerial occupations
Explore more demographic insights in this area
Go to Demographics tabPlanning
Planning Constraints
- Flood RiskPremium
- Ramsar Wetland SitesPremium
- Area of Outstanding Natural BeautyPremium
- Protected Nature ReservePremium
- Protected WoodlandPremium