Area Overview for PO11 0FE
Photos of PO11 0FE
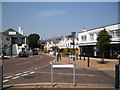
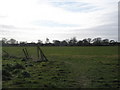
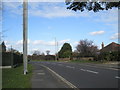
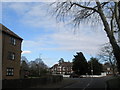
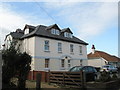
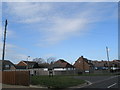
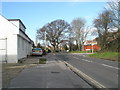
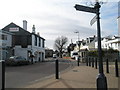
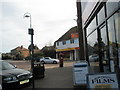
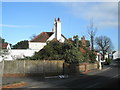
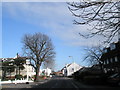
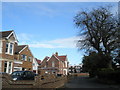
100 photos from this area
Area Information
Key information about the PO11 0FE including its size, population, and administrative classification.
- Area Type
- Postcode
- Area Size
- 1.4 hectares
- Population
- 2010
- Population Density
- 1937 people/km²
House Prices in PO11 0FE
41
Properties
£335,664
Average Sold Price
£173,250
Lowest Price
£458,000
Highest Price
Showing 41 properties
| Address | Type | Beds | Baths | Last Sale Price | Last Sale Date | |
|---|---|---|---|---|---|---|
| 38 Signal Way, Hayling Island, PO11 0FE | Detached | 4 | 1 | £435,000 | Jan 2024 | |
| 10 Signal Way, Hayling Island, PO11 0FE | Retail | 2 | 2 | £275,000 | Nov 2022 | |
| 3 Signal Way, Hayling Island, PO11 0FE | Terraced | 3 | 2 | £347,000 | Aug 2022 | |
| 6 Signal Way, Hayling Island, PO11 0FE | Semi-detached | 3 | 2 | £265,000 | Mar 2022 | |
| 5 Signal Way, Hayling Island, PO11 0FE | house | - | - | £280,000 | Jun 2021 | |
| 46 Signal Way, Hayling Island, PO11 0FE | house | - | - | £287,500 | Mar 2021 | |
| 36 Signal Way, Hayling Island, PO11 0FE | house | - | - | £395,000 | Feb 2021 | |
| 20 Signal Way, Hayling Island, PO11 0FE | Semi-detached | 3 | 1 | £173,250 | Dec 2020 | |
| 4 Signal Way, Hayling Island, PO11 0FE | Semi-detached | 3 | 2 | £290,000 | Feb 2020 | |
| 29 Signal Way, Hayling Island, PO11 0FE | house | - | - | £389,000 | Mar 2018 |
Page 1 of 5
Energy Efficiency in PO11 0FE
Amenities
Schools
| Rank | School | Type | Entry gender | Ages |
|---|
Explore more schools in this area
Go to Schools tabDemographics
Household Size
Two person
most common
Accommodation Type
Houses
most common
Tenure
81
majority
Ethnic Group
White
most common
Religion
N/A
most common
Household Composition
N/A
most common
Age
47
median
Adults (30-64 years)
most common
Household Deprivation
N/A
with no deprivation
NS-SEC
34
in Lower managerial occupations
Explore more demographic insights in this area
Go to Demographics tabPlanning
Planning Constraints
- Flood RiskPremium
- Ramsar Wetland SitesPremium
- Area of Outstanding Natural BeautyPremium
- Protected Nature ReservePremium
- Protected WoodlandPremium