Area Overview for OX1 1HT
Photos of OX1 1HT
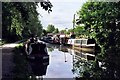
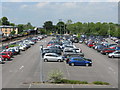

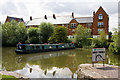


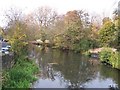


100 photos from this area
Area Information
Key information about the OX1 1HT including its size, population, and administrative classification.
- Area Type
- Postcode
- Area Size
- 3785 m²
- Population
- 9899
- Population Density
- 5355 people/km²
House Prices in OX1 1HT
36
Properties
£419,140
Average Sold Price
£185,000
Lowest Price
£950,000
Highest Price
Showing 36 properties
| Address | Type | Beds | Baths | Last Sale Price | Last Sale Date | |
|---|---|---|---|---|---|---|
| 24, The Stream Edge, Fisher Row, Oxford, OX1 1HT | Flat | 1 | 1 | £378,000 | Sep 2025 | |
| 21, The Stream Edge, Fisher Row, Oxford, OX1 1HT | Flat | 1 | 1 | £375,000 | Sep 2025 | |
| 1, The Stream Edge, Fisher Row, Oxford, OX1 1HT | Flat | - | - | £340,000 | Jan 2025 | |
| 35, The Stream Edge, Fisher Row, Oxford, OX1 1HT | Flat | 3 | 2 | £850,000 | Jan 2025 | |
| 36, The Stream Edge, Fisher Row, Oxford, OX1 1HT | Flat | 3 | 2 | £950,000 | Jun 2022 | |
| 30, The Stream Edge, Fisher Row, Oxford, OX1 1HT | Flat | 2 | 2 | £570,500 | Apr 2022 | |
| 27, The Stream Edge, Fisher Row, Oxford, OX1 1HT | Flat | 2 | 2 | £610,000 | Dec 2021 | |
| 3, The Stream Edge, Fisher Row, Oxford, OX1 1HT | Flat | 1 | - | £350,000 | Aug 2021 | |
| 15, The Stream Edge, Fisher Row, Oxford, OX1 1HT | Flat | - | - | £500,000 | Jan 2021 | |
| 11, The Stream Edge, Fisher Row, Oxford, OX1 1HT | Flat | - | - | £388,000 | Mar 2020 |
Page 1 of 4
Energy Efficiency in OX1 1HT
Amenities
Schools
| Rank | School | Type | Entry gender | Ages |
|---|
Explore more schools in this area
Go to Schools tabDemographics
Household Size
One person
most common
Accommodation Type
Flats
most common
Tenure
18
majority
Ethnic Group
White
most common
Religion
N/A
most common
Household Composition
N/A
most common
Age
22
median
Young Adults (15-29 years)
most common
Household Deprivation
N/A
with no deprivation
NS-SEC
7
in Lower managerial occupations
Explore more demographic insights in this area
Go to Demographics tabPlanning
Planning Constraints
- Flood RiskPremium
- Ramsar Wetland SitesPremium
- Area of Outstanding Natural BeautyPremium
- Protected Nature ReservePremium
- Protected WoodlandPremium