Area Overview for KT13 9QS
Photos of KT13 9QS
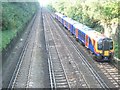
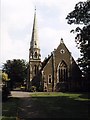
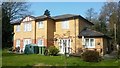
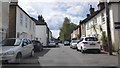
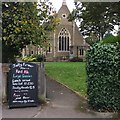
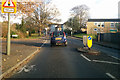
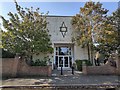
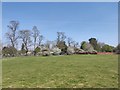
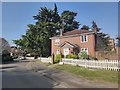
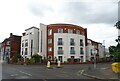
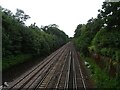
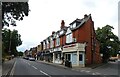
30 photos from this area
Area Information
Key information about the KT13 9QS including its size, population, and administrative classification.
- Area Type
- Postcode
- Area Size
- 4713 m²
- Population
- 1669
- Population Density
- 2971 people/km²
House Prices in KT13 9QS
14
Properties
£449,667
Average Sold Price
£180,000
Lowest Price
£750,000
Highest Price
Showing 14 properties
| Address | Type | Beds | Baths | Last Sale Price | Last Sale Date | |
|---|---|---|---|---|---|---|
| 3 Hungerford Square, Weybridge, KT13 9QS | Terraced | 4 | 1 | £750,000 | Jun 2022 | |
| 5 Hungerford Square, Weybridge, KT13 9QS | Terraced | 3 | 1 | £626,000 | Jun 2020 | |
| 2 Hungerford Square, Weybridge, KT13 9QS | Terraced | 3 | 1 | £400,000 | Dec 2012 | |
| 11 Hungerford Square, Weybridge, KT13 9QS | house | 3 | - | £430,000 | Aug 2011 | |
| 7 Hungerford Square, Weybridge, KT13 9QS | Terraced | 3 | 1 | £312,000 | Jan 2006 | |
| 9 Hungerford Square, Weybridge, KT13 9QS | Terraced | - | - | £180,000 | Mar 1998 | |
| 8 Hungerford Square, Weybridge, KT13 9QS | Terraced | 3 | 2 | - | - | |
| 14 Hungerford Square, Weybridge, KT13 9QS | Detached | 3 | 1 | - | - | |
| 1 Hungerford Square, Weybridge, KT13 9QS | Terraced | 3 | 1 | - | - | |
| 12 Hungerford Square, Weybridge, KT13 9QS | Terraced | 3 | 1 | - | - |
Page 1 of 2
Energy Efficiency in KT13 9QS
Amenities
Schools
| Rank | School | Type | Entry gender | Ages |
|---|
Explore more schools in this area
Go to Schools tabDemographics
Household Size
Family (3-5 people)
most common
Accommodation Type
Houses
most common
Tenure
83
majority
Ethnic Group
White
most common
Religion
N/A
most common
Household Composition
N/A
most common
Age
47
median
Adults (30-64 years)
most common
Household Deprivation
N/A
with no deprivation
NS-SEC
61
in Lower managerial occupations
Explore more demographic insights in this area
Go to Demographics tabPlanning
Planning Constraints
- Flood RiskPremium
- Ramsar Wetland SitesPremium
- Area of Outstanding Natural BeautyPremium
- Protected Nature ReservePremium
- Protected WoodlandPremium