Area Overview for Handcross & Pease Pottage Ward
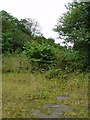
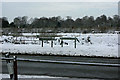
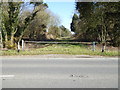
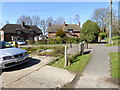
Photos of Handcross & Pease Pottage Ward
Area Information
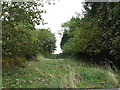
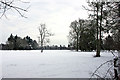
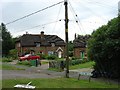
Handcross & Pease Pottage Ward is a compact electoral ward covering an area of 15.0 km² within the Mid Sussex District Council region. The ward encompasses the villages of Handcross and Pease Pottage, situated primarily under the RH17 6** postcodes with some expansion into the RH11 9** area. Its location places residents near the border with Crawley borough and inside the Horsham parliamentary constituency. This boundary map defines the specific limits where you will live, coordinate your address, and access local services. The geography supports a settlement pattern focused on these two named villages rather than a continuous urban sprawl. You will find yourself in a South East England setting that balances rural character with manageable commuting distances. The ward code E05014725 identifies this specific administrative unit for council taxes and voting purposes. Living here means navigating a landscape shaped by the surrounding parishes and district boundaries. The total area size ensures that distances between homes and centres are generally short within the defined limits. This ward offers a defined space where local governance, postal services, and community facilities operate within a clear geographical framework. The specific coordinates of approximately 51.066°N, 0.194°W mark the central point of this residential zone.
- Area Type
- District Borough Unitary Ward
- Area Size
- 15.0 km²
- Population
- Not available
- Population Density
- Not available
Demographics
You will find that the community in Handcross & Pease Pottage Ward is heavily skewed towards older residents, with a median age of 70 years. This demographic profile indicates a population likely to include retirees and individuals approaching retirement. The most common age range listed is total, reflecting a full census count rather than a narrow slice of the population. Such an age structure often correlates with higher rates of home ownership, which you will find stands at 67%. This means two-thirds of households are owner-occupied rather than rented. While specific data on ethnic diversity, religious affiliation, and detailed household composition types are not included in the current report, the high ownership figure suggests long-term residency stability. This demographic makeup influences the local services you might expect, including healthcare access and leisure activities suited to seniors. A quarter of the population rents their home, indicating a smaller but present segment of tenants or younger residents moving into the area. The housing stock likely reflects preferences for permanence common in this age group. Understanding these figures helps you gauge the social environment of the villages within the ward boundaries.
Household Size
Accommodation Type
Tenure
Ethnic Group
Religion
Household Composition
Age
Household Deprivation
NS-SEC
Explore more demographic insights in this area
Go to Demographics tabPlanning
Planning Constraints
- Flood RiskPremium
- Ramsar Wetland SitesPremium
- Area of Outstanding Natural BeautyPremium
- Protected Nature ReservePremium
- Protected WoodlandPremium
- Crime RiskPremium