Area Overview for GU14 9DD
Photos of GU14 9DD


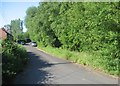
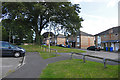
100 photos from this area
Area Information
Key information about the GU14 9DD including its size, population, and administrative classification.
- Area Type
- Postcode
- Area Size
- 1.4 hectares
- Population
- 1641
- Population Density
- 4209 people/km²
House Prices in GU14 9DD
42
Properties
£267,263
Average Sold Price
£101,000
Lowest Price
£415,000
Highest Price
Showing 42 properties
| Address | Type | Beds | Baths | Last Sale Price | Last Sale Date | |
|---|---|---|---|---|---|---|
| 29 All Saints Crescent, Farnborough, GU14 9DD | house | - | - | £275,000 | Jun 2025 | |
| 33 All Saints Crescent, Farnborough, GU14 9DD | Semi-detached | 3 | 2 | £415,000 | Mar 2025 | |
| 81 All Saints Crescent, Farnborough, GU14 9DD | Semi-detached | 3 | 1 | £375,000 | Nov 2022 | |
| 65 All Saints Crescent, Farnborough, GU14 9DD | Semi-detached | 3 | 1 | £370,000 | Oct 2022 | |
| 35 All Saints Crescent, Farnborough, GU14 9DD | house | - | - | £318,000 | Dec 2021 | |
| 9 All Saints Crescent, Farnborough, GU14 9DD | Terraced | 3 | 1 | £315,000 | Mar 2021 | |
| 41 All Saints Crescent, Farnborough, GU14 9DD | house | - | - | £290,000 | Mar 2021 | |
| 55 All Saints Crescent, Farnborough, GU14 9DD | Terraced | 2 | 1 | £256,000 | Oct 2020 | |
| 17 All Saints Crescent, Farnborough, GU14 9DD | house | 2 | - | £246,500 | Mar 2018 | |
| 73 All Saints Crescent, Farnborough, GU14 9DD | Semi-detached | 3 | 1 | £272,000 | Dec 2017 |
Page 1 of 5
Energy Efficiency in GU14 9DD
Amenities
Schools
| Rank | School | Type | Entry gender | Ages |
|---|
Explore more schools in this area
Go to Schools tabDemographics
Household Size
Family (3-5 people)
most common
Accommodation Type
Houses
most common
Tenure
62
majority
Ethnic Group
White
most common
Religion
N/A
most common
Household Composition
N/A
most common
Age
47
median
Adults (30-64 years)
most common
Household Deprivation
N/A
with no deprivation
NS-SEC
32
in Lower managerial occupations
Explore more demographic insights in this area
Go to Demographics tabPlanning
Planning Constraints
- Flood RiskPremium
- Ramsar Wetland SitesPremium
- Area of Outstanding Natural BeautyPremium
- Protected Nature ReservePremium
- Protected WoodlandPremium