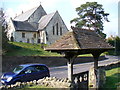
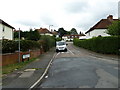
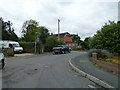
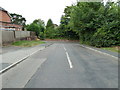
Area Overview for Farnham Rowledge Ward
Photos of Farnham Rowledge Ward
Area Information
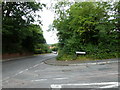
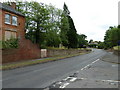
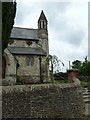
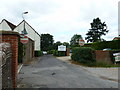
Farnham Rowledge Ward covers an area of 5.1 km² within the borough. Living in Farnham Rowledge Ward offers a distinct setting defined by its existing constraints and settlement character. The ward represents a specific local authority unit where residents navigate a defined landscape. You will find that daily life here is shaped by a mix of residential zones and natural features that require careful planning consideration. The compact size of this district means that infrastructure and amenities are concentrated in a relatively small footprint. Potential buyers looking at Farnham Rowledge Ward should understand that the area operates under specific planning rules regarding nature and safety. This includes designated protected woodlands and flood risk zones that influence development and maintenance. Understanding these physical boundaries is essential for making an informed decision about purchasing homes in Farnham Rowledge Ward. The area does not sit within an Area of Outstanding Natural Beauty, Ramsar wetland site, or a general protected nature reserve, which simplifies some planning constraints while they remain elsewhere. The demographic makeup suggests a mature local community. A median age of 70 years indicates an older population base compared to the national average. This statistic defines the neighbourhood character significantly, suggesting quiet streets and established households rather than a buoyant student or young family scene. When considering living in Farnham Rowledge Ward, you must account for this settlement pattern. The total household composition reflects a stable community structure with high levels of long-term residence. Eighty-nine per cent of the designation for environmental safety scores points to a generally safe environment. However, the presence of a warning level for flood risk coverage and protected woodland means that site selection within the 5.1 km² remains a critical step. Buyers should inspect specific plots for these constraints before proceeding. The ward functions as a self-contained district where the natural environment holds a significant influence on property values and future growth potential.
- Area Type
- District Borough Unitary Ward
- Area Size
- 5.1 km²
- Population
- Not available
- Population Density
- Not available
Demographics
Living in Farnham Rowledge Ward means residing in a community with a profound focus on retirees. The data indicates a median age of 70 years, placing this area firmly within the older demographic category. This age profile significantly shapes the local culture, retail needs, and social infrastructure. Most people fall into the 'Age: Total' range, reinforcing the idea that this is a retirement-focused district rather than a multi-generational hub for young families. You will find few young adults under thirty-five in the traditional household formation sense, as the dominant age group dictates the rhythm of neighbourhood life. This demographic reality informs why certain amenities dominate the local high street while others may be scarce. The social fabric here revolves around activities and services tailored to an older clientele, creating a peaceful but age-skewed environment. Home ownership stands at 79 per cent, which is a substantive majority figure for the ward. This statistic confirms that Farnham Rowledge Ward is an established owner-occupied area rather than a high-demand rental market. A high ownership rate like this suggests stability and lower tenant turnover, which often translates to quieter streets and long-term neighbours. The remaining 21 per cent of households likely consist of private landlords or social housing tenants, but they are not the defining group. Overall accommodation types reflect this ownership dominance, with permanent residences outnumbering temporary or short-term lets. The household composition data shows no significant breakdown into family units or student halls, further supporting the conclusion that this is a settled, elderly population. When you move to Farnham Rowledge Ward, you are joining a community where residents have stayed for decades. The high ownership percentage creates a sense of permanence that is attractive to buyers who value stability. Ethnic diversity and religious affiliation data are not provided in the specific records for this ward. Consequently, the primary demographic marker remains the age score of 70 and the 79 per cent ownership figure. You can confidently state that the local shops and community groups cater to the needs of this older, predominantly owner-occupied group. The lack of young families in the household composition data means that noise levels, blade-mower bans, and teen-related disturbance are likely minimal complaints. However, the absence of younger commuters during school run peaks or evening social gatherings might make the area feel very quiet at certain times. The 79 per cent home ownership rate also implies a robust local economy dependent on pension income rather than high turnover rental income. This demographic reality is the single most important fact when deciding whether Farnham Rowledge Ward suits your lifestyle needs.
Household Size
Accommodation Type
Tenure
Ethnic Group
Religion
Household Composition
Age
Household Deprivation
NS-SEC
Explore more demographic insights in this area
Go to Demographics tabPlanning
Planning Constraints
- Flood RiskPremium
- Ramsar Wetland SitesPremium
- Area of Outstanding Natural BeautyPremium
- Protected Nature ReservePremium
- Protected WoodlandPremium