Area Overview for Fant & Oakwood Ward
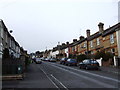
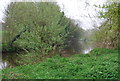
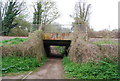
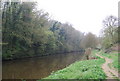
Photos of Fant & Oakwood Ward
Area Information
Fant & Oakwood Ward defines a compact residential district within Maidstone Borough Council in Kent. The area spans 2.8 square kilometres and serves approximately 1,707 residents. You live in a locality where population density reaches 614 people per square kilometre, creating a close-knit environment without the sprawl of larger urban zones. This ward functions as an electoral unit represented by three councillors on the local council. The geography remains static and well-defined, appearing clearly on official ward boundary maps maintained by the authority. Research confirms its status as a distinct within the unitary authority area, situated at specific geographic coordinates. Daily life here revolves around a stable community where thousands call the small site home. You navigate a neighbourhood where the total resident count stays consistent with historical records. The area stands out for its manageable scale and clear administrative boundaries. Living in Fant & Oakwood Ward means engaging with a space where every resident knows their exact place in the local governance structure. The ward offers a straightforward layout that avoids unnecessary complexity for those seeking a defined living experience.
- Area Type
- District Borough Unitary Ward
- Area Size
- 2.8 km²
- Population
- 1707
- Population Density
- 614 people/km²
Demographics
The community structure reflects a mature population with a median age of 70 years. This demographic profile places Fant & Oakwood Ward significantly above national averages for younger households. You are more likely to encounter residents in their later years than in a typical suburban ward. The age distribution lacks younger cohorts, suggesting a retirement-focused settlement pattern. Home ownership stands at 55 per cent of the total population, indicating that roughly one in two residents owns their property outright. This figure suggests a moderate reliance on rental accommodation compared to owner-occupier dominance. Household composition data remains aggregated under broad categories rather than specific family units. Accommodation types cluster under general classifications without detailed brick-and-mortar breakdowns. The ethnic and religious breakdowns also present as total aggregates without name-specific subgroups. These figures indicate a homogenous demographic profile where specific cultural minorities do not appear as distinct data points. Residents experience a society defined by age and ownership status rather than diverse heritage or family structures. The 55 per cent ownership rate remains the single most concrete metric defining the economic structure of households here.
Household Size
Accommodation Type
Tenure
Ethnic Group
Religion
Household Composition
Age
Household Deprivation
NS-SEC
Explore more demographic insights in this area
Go to Demographics tabPlanning
Planning Constraints
- Flood RiskPremium
- Ramsar Wetland SitesPremium
- Area of Outstanding Natural BeautyPremium
- Protected Nature ReservePremium
- Protected WoodlandPremium
- Crime RiskPremium