Area Overview for BN3 5LY
Photos of BN3 5LY
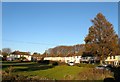
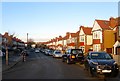
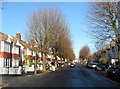
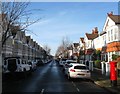
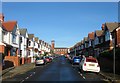
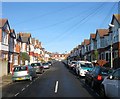
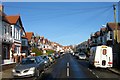
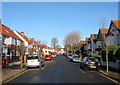
100 photos from this area
Area Information
Key information about the BN3 5LY including its size, population, and administrative classification.
- Area Type
- Postcode
- Area Size
- 9385 m²
- Population
- 1555
- Population Density
- 10528 people/km²
House Prices in BN3 5LY
79
Properties
£197,106
Average Sold Price
£92,000
Lowest Price
£270,000
Highest Price
Showing 79 properties
| Address | Type | Beds | Baths | Last Sale Price | Last Sale Date | |
|---|---|---|---|---|---|---|
| 9, Benson Court, Ingram Crescent East, Hove, BN3 5LY | Flat | - | - | £270,000 | Jun 2022 | |
| 21, Benson Court, Ingram Crescent East, Hove, BN3 5LY | Flat | - | - | £250,000 | Dec 2021 | |
| 46, Benson Court, Ingram Crescent East, Hove, BN3 5LY | Flat | 2 | 1 | £247,500 | Sep 2021 | |
| 78, Benson Court, Ingram Crescent East, Hove, BN3 5LY | Flat | - | - | £160,000 | Aug 2019 | |
| 48, Benson Court, Ingram Crescent East, Hove, BN3 5LY | Flat | - | - | £250,000 | Feb 2019 | |
| 42, Benson Court, Ingram Crescent East, Hove, BN3 5LY | Flat | - | - | £232,500 | Jan 2019 | |
| 39, Benson Court, Ingram Crescent East, Hove, BN3 5LY | Flat | - | - | £200,000 | Apr 2018 | |
| 4, Benson Court, Ingram Crescent East, Hove, BN3 5LY | Flat | - | - | £240,000 | Nov 2017 | |
| 77, Benson Court, Ingram Crescent East, Hove, BN3 5LY | Flat | - | - | £235,000 | May 2017 | |
| 13, Benson Court, Ingram Crescent East, Hove, BN3 5LY | Flat | - | - | £232,500 | Jul 2016 |
Page 1 of 8
Energy Efficiency in BN3 5LY
Amenities
Schools
| Rank | School | Type | Entry gender | Ages |
|---|
Explore more schools in this area
Go to Schools tabDemographics
Household Size
One person
most common
Accommodation Type
Flats
most common
Tenure
34
majority
Ethnic Group
White
most common
Religion
N/A
most common
Household Composition
N/A
most common
Age
47
median
Adults (30-64 years)
most common
Household Deprivation
N/A
with no deprivation
NS-SEC
28
in Lower managerial occupations
Explore more demographic insights in this area
Go to Demographics tabPlanning
Planning Constraints
- Flood RiskPremium
- Ramsar Wetland SitesPremium
- Area of Outstanding Natural BeautyPremium
- Protected Nature ReservePremium
- Protected WoodlandPremium