Area Overview for BN16 2PE
Photos of BN16 2PE
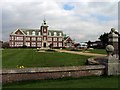
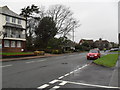
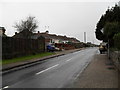
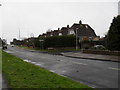
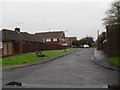
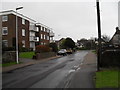
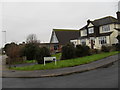
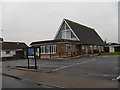
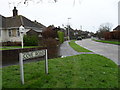
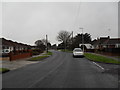
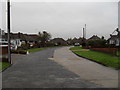
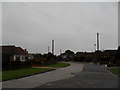
100 photos from this area
Area Information
Key information about the BN16 2PE including its size, population, and administrative classification.
- Area Type
- Postcode
- Area Size
- 1.5 hectares
- Population
- Not available
- Population Density
- Not available
House Prices in BN16 2PE
31
Properties
£261,358
Average Sold Price
£75,000
Lowest Price
£485,000
Highest Price
Showing 31 properties
| Address | Type | Beds | Baths | Last Sale Price | Last Sale Date | |
|---|---|---|---|---|---|---|
| 26 The Crescent, Rustington, BN16 2PE | Detached | 2 | 1 | £435,000 | Dec 2025 | |
| 24 The Crescent, Rustington, BN16 2PE | Detached | 3 | 2 | £485,000 | Nov 2021 | |
| 18 The Crescent, Rustington, BN16 2PE | Bungalow | - | - | £370,000 | Aug 2021 | |
| 14 The Crescent, Rustington, BN16 2PE | Bungalow | 3 | 1 | £350,000 | Feb 2020 | |
| 29 The Crescent, Rustington, BN16 2PE | Detached | 2 | 1 | £295,000 | Aug 2018 | |
| 6 The Crescent, Rustington, BN16 2PE | Bungalow | - | - | £275,000 | Nov 2017 | |
| 9 The Crescent, Rustington, BN16 2PE | Bungalow | 2 | - | £429,950 | Oct 2017 | |
| 7 The Crescent, Rustington, BN16 2PE | Bungalow | 4 | 2 | £306,000 | Sep 2014 | |
| 23 The Crescent, Rustington, BN16 2PE | Bungalow | 2 | 2 | £279,950 | Aug 2014 | |
| 22 The Crescent, Rustington, BN16 2PE | Bungalow | 3 | 1 | £335,000 | Jul 2014 |
Page 1 of 4
Energy Efficiency in BN16 2PE
Amenities
Schools
| Rank | School | Type | Entry gender | Ages |
|---|
Explore more schools in this area
Go to Schools tabDemographics
Household Size
Two person
most common
Accommodation Type
Houses
most common
Tenure
88
majority
Ethnic Group
White
most common
Religion
N/A
most common
Household Composition
N/A
most common
Age
47
median
Elderly (65+ years)
most common
Household Deprivation
N/A
with no deprivation
NS-SEC
34
in Lower managerial occupations
Explore more demographic insights in this area
Go to Demographics tabPlanning
Planning Constraints
- Flood RiskPremium
- Ramsar Wetland SitesPremium
- Area of Outstanding Natural BeautyPremium
- Protected Nature ReservePremium
- Protected WoodlandPremium