Area Overview for OL10 3PD
Photos of OL10 3PD
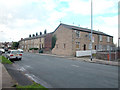

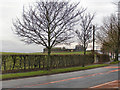
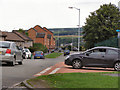
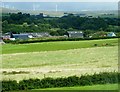
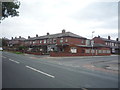
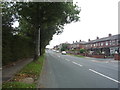
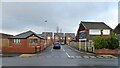
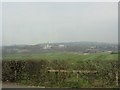
35 photos from this area
Area Information
Key information about the OL10 3PD including its size, population, and administrative classification.
- Area Type
- Postcode
- Area Size
- 2.4 hectares
- Population
- 1844
- Population Density
- 717 people/km²
House Prices in OL10 3PD
39
Properties
£125,862
Average Sold Price
£73,000
Lowest Price
£190,000
Highest Price
Showing 39 properties
| Address | Type | Beds | Baths | Last Sale Price | Last Sale Date | |
|---|---|---|---|---|---|---|
| 63C Sutherland Road, Heywood, OL10 3PD | Retail | 3 | 2 | £158,000 | Jul 2022 | |
| 99 Sutherland Road, Heywood, OL10 3PD | house | - | - | £190,000 | Aug 2021 | |
| 73 Sutherland Road, Heywood, OL10 3PD | house | 3 | 1 | £73,000 | May 2018 | |
| 63H Sutherland Road, Heywood, OL10 3PD | Terraced | - | - | £101,645 | Apr 2015 | |
| 63B Sutherland Road, Heywood, OL10 3PD | house | 3 | 2 | £124,995 | Nov 2014 | |
| 63G Sutherland Road, Heywood, OL10 3PD | house | - | - | £110,995 | Sep 2014 | |
| 63A Sutherland Road, Heywood, OL10 3PD | house | 3 | 2 | £124,995 | Jun 2014 | |
| 63D Sutherland Road, Heywood, OL10 3PD | Semi-detached | 3 | 1 | £124,995 | Apr 2014 | |
| 63E Sutherland Road, Heywood, OL10 3PD | Semi-detached | 3 | 2 | £124,995 | Dec 2013 | |
| 63F Sutherland Road, Heywood, OL10 3PD | Semi-detached | 3 | 1 | £124,995 | Dec 2013 |
Page 1 of 4
Energy Efficiency in OL10 3PD
Amenities
Schools
| Rank | School | Type | Entry gender | Ages |
|---|
Explore more schools in this area
Go to Schools tabDemographics
Household Size
Family (3-5 people)
most common
Accommodation Type
Houses
most common
Tenure
57
majority
Ethnic Group
White
most common
Religion
N/A
most common
Household Composition
N/A
most common
Age
47
median
Adults (30-64 years)
most common
Household Deprivation
N/A
with no deprivation
NS-SEC
24
in Lower managerial occupations
Explore more demographic insights in this area
Go to Demographics tabPlanning
Planning Constraints
- Flood RiskPremium
- Ramsar Wetland SitesPremium
- Area of Outstanding Natural BeautyPremium
- Protected Nature ReservePremium
- Protected WoodlandPremium