Area Overview for L7 6LS
Photos of L7 6LS
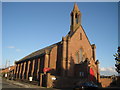
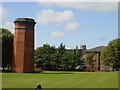
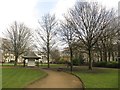
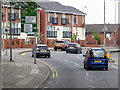
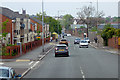
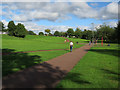
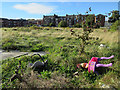
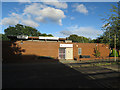
66 photos from this area
Area Information
Key information about the L7 6LS including its size, population, and administrative classification.
- Area Type
- Postcode
- Area Size
- 8780 m²
- Population
- 3789
- Population Density
- 5164 people/km²
House Prices in L7 6LS
36
Properties
£123,087
Average Sold Price
£100,000
Lowest Price
£170,000
Highest Price
Showing 36 properties
| Address | Type | Beds | Baths | Last Sale Price | Last Sale Date | |
|---|---|---|---|---|---|---|
| 138 Tunnel Road, Liverpool, L7 6LS | Terraced | 3 | 2 | £170,000 | May 2024 | |
| 134 Tunnel Road, Liverpool, L7 6LS | Semi-detached | 3 | 2 | £131,000 | Feb 2021 | |
| 82 Tunnel Road, Liverpool, L7 6LS | Semi-detached | 2 | 2 | £120,000 | Jan 2021 | |
| 132 Tunnel Road, Liverpool, L7 6LS | Semi-detached | 3 | 1 | £137,000 | Nov 2019 | |
| 74 Tunnel Road, Liverpool, L7 6LS | Terraced | 3 | 1 | £130,000 | Sep 2019 | |
| 100 Tunnel Road, Liverpool, L7 6LS | Semi-detached | 3 | 1 | £125,000 | Nov 2018 | |
| 118 Tunnel Road, Liverpool, L7 6LS | Semi-detached | 3 | 1 | £130,000 | Dec 2017 | |
| 98 Tunnel Road, Liverpool, L7 6LS | Semi-detached | 3 | 1 | £130,000 | Nov 2017 | |
| 116 Tunnel Road, Liverpool, L7 6LS | Semi-detached | 3 | 1 | £112,000 | Dec 2013 | |
| 140 Tunnel Road, Liverpool, L7 6LS | house | - | - | £119,995 | Jul 2012 |
Page 1 of 4
Energy Efficiency in L7 6LS
Amenities
Schools
| Rank | School | Type | Entry gender | Ages |
|---|
Explore more schools in this area
Go to Schools tabDemographics
Household Size
One person
most common
Accommodation Type
Houses
most common
Tenure
34
majority
Ethnic Group
White
most common
Religion
N/A
most common
Household Composition
N/A
most common
Age
47
median
Adults (30-64 years)
most common
Household Deprivation
N/A
with no deprivation
NS-SEC
16
in Lower managerial occupations
Explore more demographic insights in this area
Go to Demographics tabPlanning
Planning Constraints
- Flood RiskPremium
- Ramsar Wetland SitesPremium
- Area of Outstanding Natural BeautyPremium
- Protected Nature ReservePremium
- Protected WoodlandPremium