Area Overview for L13 7BN
Photos of L13 7BN
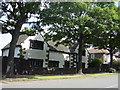
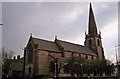
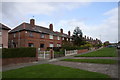
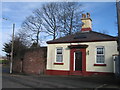
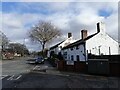
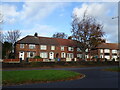
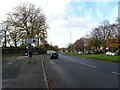
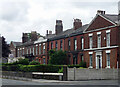
26 photos from this area
Area Information
Key information about the L13 7BN including its size, population, and administrative classification.
- Area Type
- Postcode
- Area Size
- 6245 m²
- Population
- 1434
- Population Density
- 3908 people/km²
House Prices in L13 7BN
32
Properties
£107,925
Average Sold Price
£36,000
Lowest Price
£150,000
Highest Price
Showing 32 properties
| Address | Type | Beds | Baths | Last Sale Price | Last Sale Date | |
|---|---|---|---|---|---|---|
| 33 Richland Road, Liverpool, L13 7BN | Detached | 3 | 1 | £147,000 | Apr 2025 | |
| 35 Richland Road, Liverpool, L13 7BN | house | - | - | £120,000 | Apr 2022 | |
| 45 Richland Road, Liverpool, L13 7BN | house | - | - | £150,000 | Mar 2022 | |
| 51 Richland Road, Liverpool, L13 7BN | Semi-detached | 3 | - | £128,000 | Sep 2018 | |
| 65 Richland Road, Liverpool, L13 7BN | house | - | - | £150,000 | Sep 2018 | |
| 17 Richland Road, Liverpool, L13 7BN | Semi-detached | 3 | 1 | £133,000 | Jan 2018 | |
| 61 Richland Road, Liverpool, L13 7BN | house | 3 | - | £105,000 | Nov 2014 | |
| 57 Richland Road, Liverpool, L13 7BN | Semi-detached | 3 | - | £130,000 | Aug 2014 | |
| 7 Richland Road, Liverpool, L13 7BN | house | - | - | £120,000 | Jun 2013 | |
| 43 Richland Road, Liverpool, L13 7BN | Semi-detached | - | - | £120,000 | Nov 2012 |
Page 1 of 4
Energy Efficiency in L13 7BN
Amenities
Schools
| Rank | School | Type | Entry gender | Ages |
|---|
Explore more schools in this area
Go to Schools tabDemographics
Household Size
One person
most common
Accommodation Type
Houses
most common
Tenure
44
majority
Ethnic Group
White
most common
Religion
N/A
most common
Household Composition
N/A
most common
Age
47
median
Adults (30-64 years)
most common
Household Deprivation
N/A
with no deprivation
NS-SEC
21
in Lower managerial occupations
Explore more demographic insights in this area
Go to Demographics tabPlanning
Planning Constraints
- Flood RiskPremium
- Ramsar Wetland SitesPremium
- Area of Outstanding Natural BeautyPremium
- Protected Nature ReservePremium
- Protected WoodlandPremium