Area Overview for FY8 2EU
Photos of FY8 2EU
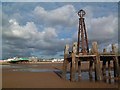
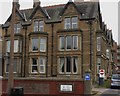


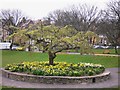
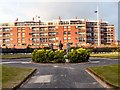

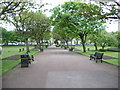
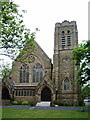
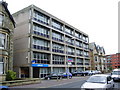
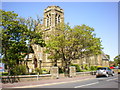
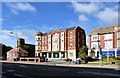
100 photos from this area
Area Information
Key information about the FY8 2EU including its size, population, and administrative classification.
- Area Type
- Postcode
- Area Size
- 1088 m²
- Population
- 1610
- Population Density
- 1480208 people/km²
House Prices in FY8 2EU
35
Properties
£142,000
Average Sold Price
£102,000
Lowest Price
£185,000
Highest Price
Showing 35 properties
| Address | Type | Beds | Baths | Last Sale Price | Last Sale Date | |
|---|---|---|---|---|---|---|
| 20, St Georges Court, St Georges Road, Lytham St Annes, FY8 2EU | Flat | - | - | £180,000 | May 2014 | |
| 12, St Georges Court, St Georges Road, Lytham St Annes, FY8 2EU | Flat | - | - | £185,000 | May 2014 | |
| 25, St Georges Court, St Georges Road, Lytham St Annes, FY8 2EU | Flat | - | - | £108,000 | Apr 2014 | |
| 9, St Georges Court, St Georges Road, Lytham St Annes, FY8 2EU | Flat | - | - | £114,000 | Jan 2014 | |
| 16, St Georges Court, St Georges Road, Lytham St Annes, FY8 2EU | Flat | - | - | £170,000 | Jan 2014 | |
| 28, St Georges Court, St Georges Road, Lytham St Annes, FY8 2EU | Flat | 2 | 2 | £169,000 | Dec 2013 | |
| 24, St Georges Court, St Georges Road, Lytham St Annes, FY8 2EU | Flat | - | - | £170,000 | Dec 2013 | |
| 27, St Georges Court, St Georges Road, Lytham St Annes, FY8 2EU | Flat | 2 | 1 | £167,000 | Dec 2013 | |
| 26, St Georges Court, St Georges Road, Lytham St Annes, FY8 2EU | Flat | - | - | £106,000 | Dec 2013 | |
| 15, St Georges Court, St Georges Road, Lytham St Annes, FY8 2EU | Flat | 1 | - | £102,000 | Dec 2013 |
Page 1 of 4
Energy Efficiency in FY8 2EU
Amenities
Schools
| Rank | School | Type | Entry gender | Ages |
|---|
Explore more schools in this area
Go to Schools tabDemographics
Household Size
One person
most common
Accommodation Type
Flats
most common
Tenure
48
majority
Ethnic Group
White
most common
Religion
N/A
most common
Household Composition
N/A
most common
Age
47
median
Adults (30-64 years)
most common
Household Deprivation
N/A
with no deprivation
NS-SEC
33
in Lower managerial occupations
Explore more demographic insights in this area
Go to Demographics tabPlanning
Planning Constraints
- Flood RiskPremium
- Ramsar Wetland SitesPremium
- Area of Outstanding Natural BeautyPremium
- Protected Nature ReservePremium
- Protected WoodlandPremium