Area Overview for Davenport & Cale Green Ward
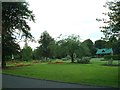
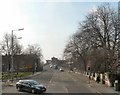
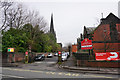
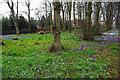
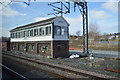
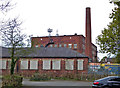
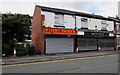
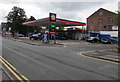
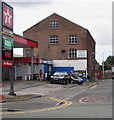
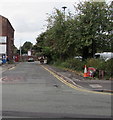
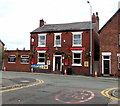
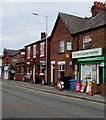
Photos of Davenport & Cale Green Ward
Area Information
Living in Davenport & Cale Green Ward offers a distinct residential experience within a compact space. The ward covers just 3.0 km², creating a neighbourhood where distances are short and the local environment is contained. Despite its small size, the population totals 1,131 residents, resulting in a density of 375 people per square kilometre. This figure indicates a community that is neither sparsely scattered nor overcrowded, maintaining a manageable scale for daily living. Davenport & Cale Green Ward functions as a defined district within the borough, providing a clear boundary for local identity. You will find this area is compact yet populated enough to sustain intimate community interactions. The physical limitations of the geography mean that amenities and homes in Davenport & Cale Green Ward are likely within easy reach of one another. Prospective residents should note that the total area size restricts the variety of housing developments that can exist here. Rather than sprawling outskirts, the ward presents a concentrated settlement pattern. For those seeking a specific locality with clear boundaries, Davenport & Cale Green Ward delivers a precise and accessible living environment.
- Area Type
- District Borough Unitary Ward
- Area Size
- 3.0 km²
- Population
- 1131
- Population Density
- 375 people/km²
Demographics
The community profile of Davenport & Cale Green Ward is defined by a significant mature population. Data shows a median age of 70, which is exceptionally high and indicates this is a retirement or senior-focused area. Most residents fall into the older age brackets, meaning the local shops and facilities likely cater to this demographic. Home ownership sits at 58%, suggesting a balanced mix of owners and renters within the ward. This rate differs from national averages and reflects the specific lifecycle stage of the population. Accommodation types and household compositions align with these age statistics, implying larger properties or bungalows may be common. You will encounter neighbours who have lived here for decades rather than recent movers seeking urban lifestyles. The predominant ethnic group and religious makeup are not detailed in available statistics, so specific diversity metrics remain unquantified in current reports. Deprivation levels are absent from the provided data, making it impossible to assess economic inequality within the ward. Nevertheless, the high age profile is the defining social characteristic. Living here means sharing daily life with an older generation, which influences the local pace and available services.
Household Size
Accommodation Type
Tenure
Ethnic Group
Religion
Household Composition
Age
Household Deprivation
NS-SEC
Explore more demographic insights in this area
Go to Demographics tabPlanning
Planning Constraints
- Flood RiskPremium
- Ramsar Wetland SitesPremium
- Area of Outstanding Natural BeautyPremium
- Protected Nature ReservePremium
- Protected WoodlandPremium
- Crime RiskPremium