Area Overview for Croston, Mawdesley & Euxton South Ward
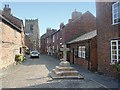
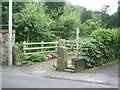
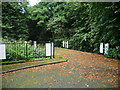
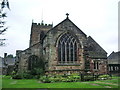
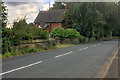
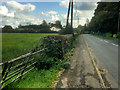
Photos of Croston, Mawdesley & Euxton South Ward


Area Information
Living in Croston, Mawdesley & Euxton South Ward offers a distinct experience defined by its compact size and mature demographic. This district borough unitary ward covers an area of 42.6 square kilometres, providing a specific footprint for its residents. The community is heavily settled, with a population of 1640 people. You will find that the pace of life here reflects an older population, where the median age reaches 70 years. This indicates a neighbourhood largely composed of retirees or long-term residents rather than young professionals moving in. The population density sits at 39 people per square kilometre, suggesting a relatively spacious feel where houses are not tightly packed. When you visit, you are entering an established environment that has remained stable for generations. The area is situated in England, functioning as a specific geographical unit within the wider local governance structure. For those researching homes in Croston, Mawdesley & Euxton South Ward, the scale of the ward means everything within these boundaries shares a common character. The low density and high age profile create a predictable rhythm to daily life here. There is little transient activity, and the community identity revolves around the people who have called this ward home for decades. Understanding the physical boundaries is crucial when viewing properties in this specific ward. The 42.6 square kilometre expanse holds all 1640 residents together. You are not looking at a bustling metropolitan zone but rather a defined residential district with clear limits. The statistics paint a picture of a place where family histories intersect with modern housing needs.
- Area Type
- District Borough Unitary Ward
- Area Size
- 42.6 km²
- Population
- 1640
- Population Density
- 39 people/km²
Demographics
The community within Croston, Mawdesley & Euxton South Ward presents a clear demographic profile driven by age and tenure. The most significant fact regarding the population is the median age of 70. This statistic confirms that the majority of residents are in their older years. Age is the total recorded for the area, meaning there is limited representation of children or very young adults compared to the older cohort. Home ownership defines the housing tenure landscape, with 81% of households owning their property. This high figure indicates that you will encounter primarily owner-occupied stock when viewing homes in Croston, Mawdesley & Euxton South Ward. The remaining 19% consists of renters or those with different tenure statuses. The household composition data is recorded as total, providing the broadest available picture of family structures without breaking them down into specific categories like singles or families with children. Similarly, the predominant ethnic group and religion statistics are recorded as total, reflecting the overall diversity without isolated breakdowns. This level of data suggests a homogenous or stable community where demographic shifts have been gradual. For buyers considering this area, the 81% ownership rate is a key indicator of stability. You are more likely to find established residents than tenant turnover. The age profile directly influences the types of services you expect to find nearby, as the social fabric is shaped by those born in the early 20th century. The total population count of 1640 covers the entire scope of these demographics. When assessing who lives here, you are looking at a population where property ownership is the norm rather than the exception.
Household Size
Accommodation Type
Tenure
Ethnic Group
Religion
Household Composition
Age
Household Deprivation
NS-SEC
Explore more demographic insights in this area
Go to Demographics tabPlanning
Planning Constraints
- Flood RiskPremium
- Ramsar Wetland SitesPremium
- Area of Outstanding Natural BeautyPremium
- Protected Nature ReservePremium
- Protected WoodlandPremium
- Crime RiskPremium