Area Overview for Washington North Ward
Photos of Washington North Ward
Area Information
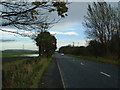
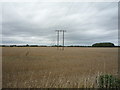
Living in Washington North Ward offers a settled lifestyle within a compact district borough unitary ward. This specific area covers 11.8 km² and serves a population of 2,479 residents. The low density of just 210 people per km² defines a quiet residential pace rather than a bustling city environment. You will find yourself in a location where space and privacy are natural features of daily life. This sizeable area relative to its population means most streets suit someone seeking tranquility over urban convenience. The ward forms part of the larger Washington community, blending local neighbourhood identity with regional connections. Prospective buyers should understand that this is a fairly small but distinct pocket of housing choice. The population figure of 2,479 indicates a community that is large enough to support local services yet small enough to remain manageable. The ward type, classified as a district borough unitary ward, suggests a specific level of local governance structure typical of the Newcastle-under-Lyme or similar Borders contexts in England. Real estate choices here cater to those prioritising space and a slower rhythm of life. You are buying into a defined geographical boundary that delivers a particular living experience. The area does not compete on dramatic scenery or high-rise density but on consistent, low-density accommodation.
- Area Type
- District Borough Unitary Ward
- Area Size
- 11.8 km²
- Population
- 2479
- Population Density
- 210 people/km²
Demographics
The community profile of Washington North Ward is defined by an exceptionally mature population. Residents here have a median age of 70, placing this ward among the oldest in England. This demographic reality shapes the entire social fabric and daily interactions within the neighbourhood. Most common age data identifies the majority as falling into total age categories, confirming a population skewed heavily towards later life. The high median age indicates that schools may be a consideration for parents moving away, while potential buyers need to consider demand from an older demographic. Home ownership stands at 46%, meaning nearly half of all households rent their homes. This split suggests a market where buy-to-let schemes or social housing may play a significant role alongside private owners. The household composition data defines the total makeup of the area, reflecting the needs of a population with fewer dependent children. You should expect a quieter environment respectful of an elderly population. The accommodation type breakdown covers the full spectrum of housing available to these residents. Despite the advanced age profile, the area remains active with a functional community structure. Understanding these figures helps buyers anticipate who their neighbours might be and what pressures the local infrastructure faces. The low population density of 210 people per km² compounds the feeling of a specialised, mature enclave rather than a mixed-family suburb.
Household Size
Accommodation Type
Tenure
Ethnic Group
Religion
Household Composition
Age
Household Deprivation
NS-SEC
Explore more demographic insights in this area
Go to Demographics tabPlanning
Planning Constraints
- Flood RiskPremium
- Ramsar Wetland SitesPremium
- Area of Outstanding Natural BeautyPremium
- Protected Nature ReservePremium
- Protected WoodlandPremium
- Crime RiskPremium