Area Overview for TS12 2UT
Photos of TS12 2UT
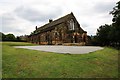
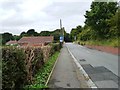
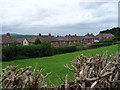
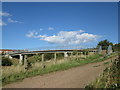
35 photos from this area
Area Information
Key information about the TS12 2UT including its size, population, and administrative classification.
- Area Type
- Postcode
- Area Size
- 4356 m²
- Population
- 1108
- Population Density
- 1543 people/km²
House Prices in TS12 2UT
11
Properties
£112,500
Average Sold Price
£67,000
Lowest Price
£140,000
Highest Price
Showing 11 properties
| Address | Type | Beds | Baths | Last Sale Price | Last Sale Date | |
|---|---|---|---|---|---|---|
| 10 Millholme Close, Brotton, TS12 2UT | Semi-detached | 3 | 1 | £133,000 | Oct 2019 | |
| 5 Millholme Close, Brotton, TS12 2UT | Bungalow | - | - | £115,000 | Dec 2017 | |
| 9 Millholme Close, Brotton, TS12 2UT | Bungalow | 2 | 1 | £130,000 | Jun 2017 | |
| 4 Millholme Close, Brotton, TS12 2UT | Bungalow | - | - | £90,000 | May 2016 | |
| 3 Millholme Close, Brotton, TS12 2UT | Semi-detached | - | - | £140,000 | Jun 2008 | |
| 7 Millholme Close, Brotton, TS12 2UT | Detached | 2 | 1 | £67,000 | Jun 2002 | |
| 1 Millholme Close, Brotton, TS12 2UT | Bungalow | 3 | - | - | - | |
| 2 Millholme Close, Brotton, TS12 2UT | Semi-detached | - | - | - | - | |
| 6 Millholme Close, Brotton, TS12 2UT | Semi-detached | - | - | - | - | |
| 8 Millholme Close, Brotton, TS12 2UT | Semi-detached | - | - | - | - |
Page 1 of 2
Energy Efficiency in TS12 2UT
Amenities
Schools
| Rank | School | Type | Entry gender | Ages |
|---|
Explore more schools in this area
Go to Schools tabDemographics
Household Size
Two person
most common
Accommodation Type
Houses
most common
Tenure
78
majority
Ethnic Group
White
most common
Religion
N/A
most common
Household Composition
N/A
most common
Age
47
median
Adults (30-64 years)
most common
Household Deprivation
N/A
with no deprivation
NS-SEC
19
in Lower managerial occupations
Explore more demographic insights in this area
Go to Demographics tabPlanning
Planning Constraints
- Flood RiskPremium
- Ramsar Wetland SitesPremium
- Area of Outstanding Natural BeautyPremium
- Protected Nature ReservePremium
- Protected WoodlandPremium