Area Overview for TS12 1PF
Photos of TS12 1PF

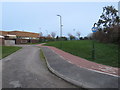


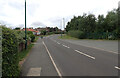

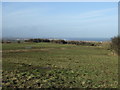


11 photos from this area
Area Information
Key information about the TS12 1PF including its size, population, and administrative classification.
- Area Type
- Postcode
- Area Size
- 7376 m²
- Population
- 1504
- Population Density
- 1409 people/km²
House Prices in TS12 1PF
21
Properties
£143,462
Average Sold Price
£57,000
Lowest Price
£230,000
Highest Price
Showing 21 properties
| Address | Type | Beds | Baths | Last Sale Price | Last Sale Date | |
|---|---|---|---|---|---|---|
| 3 Sycamore Avenue, Saltburn By The Sea, TS12 1PF | Semi-detached | 3 | 2 | £230,000 | Jun 2025 | |
| 14 Sycamore Avenue, Saltburn By The Sea, TS12 1PF | Semi-detached | 2 | 1 | £197,000 | Feb 2024 | |
| 22 Sycamore Avenue, Saltburn By The Sea, TS12 1PF | Semi-detached | 2 | 1 | £190,000 | Nov 2022 | |
| 24 Sycamore Avenue, Saltburn By The Sea, TS12 1PF | house | - | - | £167,500 | Mar 2021 | |
| 18 Sycamore Avenue, Saltburn By The Sea, TS12 1PF | Semi-detached | 2 | 1 | £148,500 | Oct 2019 | |
| 16 Sycamore Avenue, Saltburn By The Sea, TS12 1PF | Semi-detached | 2 | 1 | £148,000 | Jan 2018 | |
| 5 Sycamore Avenue, Saltburn By The Sea, TS12 1PF | Semi-detached | 3 | 1 | £134,000 | Apr 2015 | |
| 12 Sycamore Avenue, Saltburn By The Sea, TS12 1PF | house | - | - | £134,000 | Sep 2012 | |
| 4 Sycamore Avenue, Saltburn By The Sea, TS12 1PF | house | - | - | £134,000 | Apr 2012 | |
| 1 Sycamore Avenue, Saltburn By The Sea, TS12 1PF | Semi-detached | - | - | £140,000 | May 2005 |
Page 1 of 3
Energy Efficiency in TS12 1PF
Amenities
Schools
| Rank | School | Type | Entry gender | Ages |
|---|
Explore more schools in this area
Go to Schools tabDemographics
Household Size
Two person
most common
Accommodation Type
Houses
most common
Tenure
87
majority
Ethnic Group
White
most common
Religion
N/A
most common
Household Composition
N/A
most common
Age
47
median
Adults (30-64 years)
most common
Household Deprivation
N/A
with no deprivation
NS-SEC
42
in Lower managerial occupations
Explore more demographic insights in this area
Go to Demographics tabPlanning
Planning Constraints
- Flood RiskPremium
- Ramsar Wetland SitesPremium
- Area of Outstanding Natural BeautyPremium
- Protected Nature ReservePremium
- Protected WoodlandPremium