Area Overview for TS12 1AE
Photos of TS12 1AE
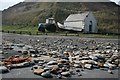
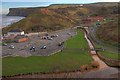

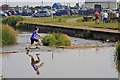
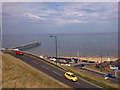
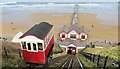
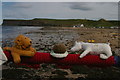
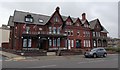
100 photos from this area
Area Information
Key information about the TS12 1AE including its size, population, and administrative classification.
- Area Type
- Postcode
- Area Size
- 5899 m²
- Population
- 1477
- Population Density
- 1779 people/km²
House Prices in TS12 1AE
33
Properties
£70,000
Average Sold Price
£65,000
Lowest Price
£75,000
Highest Price
Showing 33 properties
| Address | Type | Beds | Baths | Last Sale Price | Last Sale Date | |
|---|---|---|---|---|---|---|
| 4C Station Street, Saltburn By The Sea, TS12 1AE | Flat | - | - | £65,000 | May 2017 | |
| 4B Station Street, Saltburn By The Sea, TS12 1AE | Flat | - | - | £75,000 | Aug 2015 | |
| Flat 8, Queen Hotel, Station Street, Saltburn By The Sea, TS12 1AE | Flat | - | - | - | - | |
| Flat 7, Queen Hotel, Station Street, Saltburn By The Sea, TS12 1AE | Flat | - | - | - | - | |
| Harry Thompson & Sons, 26 Station Street, Saltburn By The Sea, TS12 1AE | retail_financial | - | - | - | - | |
| First Floor, 7 Station Street, Saltburn By The Sea, TS12 1AE | Office | - | - | - | - | |
| Flat 2, 1 Station Street, Saltburn By The Sea, TS12 1AE | Flat | - | - | - | - | |
| Flat 3, 3 Station Street, Saltburn By The Sea, TS12 1AE | Flat | - | - | - | - | |
| Flat 4, 3 Station Street, Saltburn By The Sea, TS12 1AE | Flat | - | - | - | - | |
| Flat 3, 1 Station Street, Saltburn By The Sea, TS12 1AE | Flat | - | - | - | - |
Page 1 of 4
Energy Efficiency in TS12 1AE
Amenities
Schools
| Rank | School | Type | Entry gender | Ages |
|---|
Explore more schools in this area
Go to Schools tabDemographics
Household Size
One person
most common
Accommodation Type
Houses
most common
Tenure
70
majority
Ethnic Group
White
most common
Religion
N/A
most common
Household Composition
N/A
most common
Age
47
median
Adults (30-64 years)
most common
Household Deprivation
N/A
with no deprivation
NS-SEC
37
in Lower managerial occupations
Explore more demographic insights in this area
Go to Demographics tabPlanning
Planning Constraints
- Flood RiskPremium
- Ramsar Wetland SitesPremium
- Area of Outstanding Natural BeautyPremium
- Protected Nature ReservePremium
- Protected WoodlandPremium