Area Overview for NE1 3NP
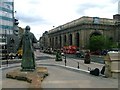
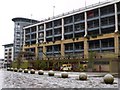
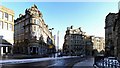
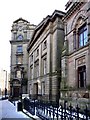
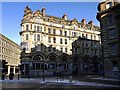
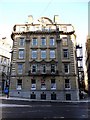
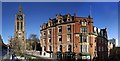
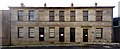
Photos of NE1 3NP


Area Information
NE1 3NP is a specific postcode covering a small residential cluster of 4710 square metres. The area is home to a population of 2061 individuals. Living in NE1 3NP provides access to a dense urban environment despite the modest physical footprint. The high population density suggests a tightly packed community where space is at a premium. Residents here experience a neighbourhood character defined by proximity and concentration. You are situated within a zone that feels compact and immediate due to the sheer number of people per square kilometre. This area serves as a distinct residential node within the wider city fabric. Daily life revolves around convenience, with essential services and transport links located immediately nearby. The demographic profile indicates a young population, which shapes the cultural and social tone of the locality. You can expect a community driven by younger professionals and students who value location over space. The environment is urban by necessity, offering limited outdoor green space within the immediate confines of the cluster. Instead, residents rely on nearby parks and city centre amenities for recreation. The compact nature of NE1 3NP means you are never far from public transport or retail outlets. This postcode represents a micro-community tightly integrated with the surrounding infrastructure of Newcastle upon Tyne.
- Area Type
- Postcode
- Area Size
- 4710 m²
- Population
- Not available
- Population Density
- Not available
The property market in NE1 3NP is defined by a heavy reliance on renting rather than ownership. Just 19 per cent of residents own their homes, meaning over 80 per cent are tenants. This statistic indicates a massive rental sector within the immediate vicinity. The predominant accommodation type is flats, which aligns perfectly with the high density of the 4710 square metre area. Flats offer the most efficient use of space in such a compact residential cluster. Buyers looking at homes in NE1 3NP should expect to compete with institutional landlords and investment portfolios. The low ownership rate signals that capital accumulation through property is difficult here. Rentals provide flexibility for young adults, explaining the dramatic female participation in the local workforce. If you are considering buying, look beyond this specific postcode to surrounding neighbourhoods with higher ownership figures. Inside NE1 3NP itself, the stock is uniform, consisting mostly of purpose-built accommodation designed for density. You will not find many semi-detached houses or large family estates. The market dynamics favour investors seeking steady rental yields from students or young professionals. For owner-occupiers, finding buy-to-let properties in this specific cluster may be challenging due to the scarcity of stock. The data confirms this area functions primarily as a housing solution for those who cannot afford to buy.
House Prices in NE1 3NP
Showing 100 properties
| Address | Type | Beds | Baths | Last Sale Price | Last Sale Date | |
|---|---|---|---|---|---|---|
| Building Plot At, 7 Hanover Square, Newcastle Upon Tyne, NE1 3NP | Retail | - | - | - | - | |
| Building Plot At, 1 Hanover Square, Newcastle Upon Tyne, NE1 3NP | Flat | - | - | - | - | |
| Building Plot At, 5 Hanover Square, Newcastle Upon Tyne, NE1 3NP | Flat | - | - | - | - | |
| Building Plot At, 3 Hanover Square, Newcastle Upon Tyne, NE1 3NP | Flat | - | - | - | - | |
| Studio 1/05, Roman House, Hanover Square, Newcastle Upon Tyne, NE1 3NP | Flat | - | - | - | - | |
| Roman House, Hanover Square, Newcastle Upon Tyne, NE1 3NP | Flat | 2 | - | - | - | |
| Cathie Associates Ltd, 2-4 Hanover Square, Newcastle Upon Tyne, NE1 3NP | office_workshop | - | - | - | - | |
| Studio 009, Roman House, Hanover Square, Newcastle Upon Tyne, NE1 3NP | studentAccommodation | - | - | - | - | |
| Studio 315, Roman House, Hanover Square, Newcastle Upon Tyne, NE1 3NP | studentAccommodation | - | - | - | - | |
| Studio 312, Roman House, Hanover Square, Newcastle Upon Tyne, NE1 3NP | studentAccommodation | - | - | - | - |
Energy Efficiency in NE1 3NP
Residents of NE1 3NP enjoy immediate access to a wide array of amenities within practical reach. Five metro stations, including Central Station and Monument, place the city centre right on your doorstep. You can reach St James for leisure or shopping without a car. Retail options are plentiful, with five major stores nearby including M&S Newcastle Rail SF, Sainsburys Newcastle, and Heron Newcastle. Sainsburys provides easy access to groceries and household essentials. Transport hubs like Manors Railway Station and Dunston Railway Station offer convenient daily commutes. Five rail stations ensure you are never stranded during peak hours. Public bus services operate from Rhodes Street for those who prefer local routes. Newcastle Airport sits just one station away, perfect for business travellers or holidaymakers. The presence of these five metro locations and five rail stations creates a highly connected lifestyle. You spend less time travelling and more time enjoying the city. Dining, cinema, and entertainment venues are clustered around the major transport nodes. The density of amenities means you can live in NE1 3NP without needing car ownership. Evening life and cultural events are accessible on foot or via short metro hops. Convenience is the defining feature of daily life here, with shops and stations always within easy reach.
Amenities
Schools
North East Futures UTC is the only secondary school listed near NE1 3NP. This institution holds a satisfactory Ofsted rating, indicating standards meet the required baseline but lack distinction. Limited school options within walking distance are typical for such a small residential cluster focusing on younger demographics. You will have access to this UTC for grounds education, but primary schools are not listed in the provided data for this specific immediate zone. The presence of one secondary option suggests a corridor of education rather than a comprehensive local catchment area. Families moving to NE1 3NP must consider driving or taking public transport to find primary education for their children. Commuting to other districts for schooling is a logistical necessity for households in this postcode. The UTC model often caters to a specific pedagogical approach, which may suit some families better than traditional grammar or comprehensive schools. Safety scores indicate a critical crime risk level, and families should weigh this against the educational provision. You should verify current travel times to the UTC before making a decision on housing location. The educational landscape is narrow, centred almost entirely on this single secondary institution. This limitation means local schools do not provide a full range of educational stages from preschool to secondary level. Prospective homebuyers must plan routes to other educational facilities outside the immediate area.
| Rank | School | Type | Entry gender | Ages |
|---|
Explore more schools in this area
Go to Schools tabDemographics
The community in NE1 3NP is remarkably young, with a median age of 22 years. Most residents fall into the young adult range between 15 and 29 years old. Only 19 per cent of households own their homes, indicating a market dominated by social housing and renting. The predominant accommodation type consists of flats, which suits the high-density urban setting. Social housing constitutes the majority of the stock in this postcode area. The population is primarily White, reflecting the broader makeup of the region. Habits formed in these young households often prioritise flexibility and proximity to employment centres over long-term investment. The low ownership rate suggests many residents are waiting to settle down or are unable to secure mortgages. You will find that neighbours are likely to be in the early stages of their adult lives. This demographic skew influences local culture, with nightlife and transport access often taking precedence over family-oriented amenities. The flat layout further supports this lifestyle, as it fits better with smaller households and singles. Tenants in NE1 3NP form the backbone of the local economy, fueling demand for services that cater to young adults. Understanding these demographics helps you navigate the social fabric of the area correctly. The data paints a clear picture of a transient, youthful population with limited property equity.
Household Size
Accommodation Type
Tenure
Ethnic Group
Religion
Household Composition
Age
Household Deprivation
NS-SEC
Explore more demographic insights in this area
Go to Demographics tabPlanning
Planning Constraints
- Flood RiskPremium
- Ramsar Wetland SitesPremium
- Area of Outstanding Natural BeautyPremium
- Protected Nature ReservePremium
- Protected WoodlandPremium