Area Overview for DL2 2DW
Photos of DL2 2DW
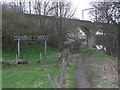

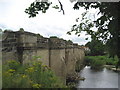
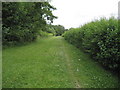
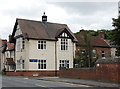
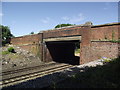
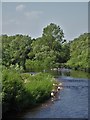
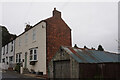
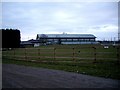
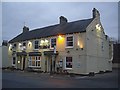
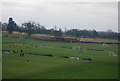
30 photos from this area
Area Information
Key information about the DL2 2DW including its size, population, and administrative classification.
- Area Type
- Postcode
- Area Size
- 3.5 hectares
- Population
- 2149
- Population Density
- 105 people/km²
House Prices in DL2 2DW
60
Properties
£142,235
Average Sold Price
£51,000
Lowest Price
£367,000
Highest Price
Showing 60 properties
| Address | Type | Beds | Baths | Last Sale Price | Last Sale Date | |
|---|---|---|---|---|---|---|
| 19A Belgrave Terrace, Hurworth Place, DL2 2DW | Terraced | 3 | 2 | £235,000 | May 2025 | |
| 16 Belgrave Terrace, Hurworth Place, DL2 2DW | Semi-detached | 2 | 1 | £210,000 | Feb 2025 | |
| 3 Belgrave Terrace, Hurworth Place, DL2 2DW | Terraced | 3 | 1 | £157,000 | Oct 2022 | |
| 7 Belgrave Terrace, Hurworth Place, DL2 2DW | house | - | - | £190,000 | Oct 2022 | |
| 1 Belgrave Terrace, Hurworth Place, DL2 2DW | Semi-detached | 2 | 1 | £110,000 | Sep 2021 | |
| 2 Belgrave Terrace, Hurworth Place, DL2 2DW | house | - | - | £367,000 | Mar 2021 | |
| 21 Belgrave Terrace, Hurworth Place, DL2 2DW | Semi-detached | 3 | 1 | £180,000 | Mar 2020 | |
| 19 Belgrave Terrace, Hurworth Place, DL2 2DW | Terraced | 3 | 2 | £137,000 | Feb 2020 | |
| 5 Belgrave Terrace, Hurworth Place, DL2 2DW | Terraced | 3 | 1 | £115,000 | Dec 2017 | |
| 23 Belgrave Terrace, Hurworth Place, DL2 2DW | house | - | - | £153,000 | Sep 2010 |
Page 1 of 6
Energy Efficiency in DL2 2DW
Amenities
Schools
| Rank | School | Type | Entry gender | Ages |
|---|
Explore more schools in this area
Go to Schools tabDemographics
Household Size
Two person
most common
Accommodation Type
Houses
most common
Tenure
70
majority
Ethnic Group
White
most common
Religion
N/A
most common
Household Composition
N/A
most common
Age
47
median
Adults (30-64 years)
most common
Household Deprivation
N/A
with no deprivation
NS-SEC
36
in Lower managerial occupations
Explore more demographic insights in this area
Go to Demographics tabPlanning
Planning Constraints
- Flood RiskPremium
- Ramsar Wetland SitesPremium
- Area of Outstanding Natural BeautyPremium
- Protected Nature ReservePremium
- Protected WoodlandPremium