Area Overview for DL17 0DG
Photos of DL17 0DG

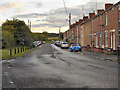
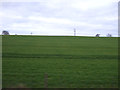
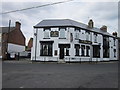
19 photos from this area
Area Information
Key information about the DL17 0DG including its size, population, and administrative classification.
- Area Type
- Postcode
- Area Size
- 2269 m²
- Population
- 1153
- Population Density
- 322 people/km²
House Prices in DL17 0DG
15
Properties
£50,157
Average Sold Price
£20,000
Lowest Price
£85,000
Highest Price
Showing 15 properties
| Address | Type | Beds | Baths | Last Sale Price | Last Sale Date | |
|---|---|---|---|---|---|---|
| 6, Firwood Terrace, Firwood Terrace Back, Chilton Lane, DL17 0DG | Terraced | 2 | 1 | £50,000 | Jul 2025 | |
| 10, Firwood Terrace, Firwood Terrace Back, Chilton Lane, DL17 0DG | Terraced | 3 | 1 | £57,000 | Jan 2024 | |
| 3, Firwood Terrace, Firwood Terrace Back, Chilton Lane, DL17 0DG | Terraced | 2 | 1 | £53,500 | Jul 2023 | |
| 12, Firwood Terrace, Firwood Terrace Back, Chilton Lane, DL17 0DG | house | 2 | 1 | £79,999 | Mar 2023 | |
| 5, FIRWOOD TERRACE, FIRWOOD TERRACE BACK, Chilton Lane, DL17 0DG | Terraced | 2 | - | £45,250 | Jul 2022 | |
| 4, Firwood Terrace, Firwood Terrace Back, Chilton Lane, DL17 0DG | house | - | - | £54,000 | Jul 2022 | |
| 13, Firwood Terrace, Firwood Terrace Back, Chilton Lane, DL17 0DG | Terraced | 3 | 1 | £58,000 | Jul 2022 | |
| 1, Firwood Terrace, Firwood Terrace Back, Chilton Lane, DL17 0DG | Terraced | 2 | 1 | £43,500 | Jul 2021 | |
| 11, Firwood Terrace, Firwood Terrace Back, Chilton Lane, DL17 0DG | Terraced | 2 | - | £29,000 | Jan 2019 | |
| 8, Firwood Terrace, Firwood Terrace Back, Chilton Lane, DL17 0DG | Terraced | 2 | 1 | £31,500 | Mar 2018 |
Page 1 of 2
Energy Efficiency in DL17 0DG
Amenities
Schools
| Rank | School | Type | Entry gender | Ages |
|---|
Explore more schools in this area
Go to Schools tabDemographics
Household Size
One person
most common
Accommodation Type
Houses
most common
Tenure
45
majority
Ethnic Group
White
most common
Religion
N/A
most common
Household Composition
N/A
most common
Age
47
median
Adults (30-64 years)
most common
Household Deprivation
N/A
with no deprivation
NS-SEC
17
in Lower managerial occupations
Explore more demographic insights in this area
Go to Demographics tabPlanning
Planning Constraints
- Flood RiskPremium
- Ramsar Wetland SitesPremium
- Area of Outstanding Natural BeautyPremium
- Protected Nature ReservePremium
- Protected WoodlandPremium