Area Overview for De Bruce Ward
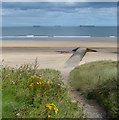
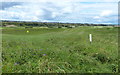
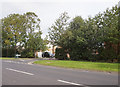
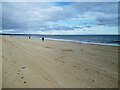
Photos of De Bruce Ward
Area Information
Living in De Bruce Ward offers a quiet residential experience within the greater Silloth-on-Sea area. This district ward covers just 3.1 km² of land, creating a tightly knit community feel. You are part of a small population of 2,284 residents, which results in a relatively high population density of 739 people per square kilometre compared to wider rural areas. The environment is characteristically local, where neighbours are likely to know one another due to the compact size of the neighbourhood. Daily life here revolves around immediate proximity, meaning your daily activities unfold within a compact footprint. The area functions as a self-contained unit where you can walk to most immediate services. It is not a sprawling urban district but a focused borough unitary ward that prioritises驻地 over extensive commercial zones. When you consider homes in De Bruce Ward, you are buying into a stable, small-scale community rather than a growing metropolitan hub. The distinctive character comes from its specific boundaries and the fact that it operates as a single, cohesive district within the local authority structure. You benefit from living in an area defined clearly by administrative lines rather than vague geographical transitions. This clarity helps with planning and community management.
- Area Type
- District Borough Unitary Ward
- Area Size
- 3.1 km²
- Population
- 2284
- Population Density
- 739 people/km²
Demographics
The community profile of De Bruce Ward is distinct because the median age is 70 years. This figure indicates that the area is populated primarily by older residents, suggesting a generation of people who have settled here long-term. You will find a demographic environment where the natural age distribution skews significantly towards retirement years. Standard age ranges are less relevant here than the central tendency of 70, which defines the social fabric. Household composition in De Bruce Ward remains a key marker of this mature community, as families with young children are less likely to be moving to this specific ward. Home ownership stands at exactly 50%, meaning half of the residents live in their own properties while the other half rent. This balance creates a mixed tenure environment, which is common in areas with an ageing population where many own their homes outright. Accommodation types reflect this demographic reality, with a higher proportion of larger dwellings suited to older occupants. The area does mask significant ethnic or religious diversity data in the provided statistics, focusing instead on age and tenure. This lack of statistical variation in those specific categories reinforces the homogeneity of the population. For you, as a potential buyer, this means the social life will cater largely to the needs of seniors rather than active families with school-age children.
Household Size
Accommodation Type
Tenure
Ethnic Group
Religion
Household Composition
Age
Household Deprivation
NS-SEC
Explore more demographic insights in this area
Go to Demographics tabPlanning
Planning Constraints
- Flood RiskPremium
- Ramsar Wetland SitesPremium
- Area of Outstanding Natural BeautyPremium
- Protected Nature ReservePremium
- Protected WoodlandPremium