Area Overview for W10 4QN
Photos of W10 4QN
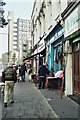
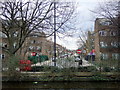

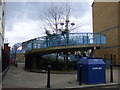
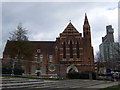
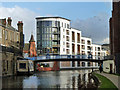
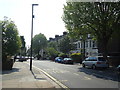
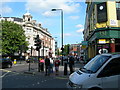
100 photos from this area
Area Information
Key information about the W10 4QN including its size, population, and administrative classification.
- Area Type
- Postcode
- Area Size
- 2851 m²
- Population
- 1881
- Population Density
- 15959 people/km²
House Prices in W10 4QN
22
Properties
£721,400
Average Sold Price
£250,000
Lowest Price
£995,000
Highest Price
Showing 22 properties
| Address | Type | Beds | Baths | Last Sale Price | Last Sale Date | |
|---|---|---|---|---|---|---|
| 10 Galton Street, London, W10 4QN | house | 2 | 2 | £990,000 | Oct 2025 | |
| 5 Galton Street, London, W10 4QN | Terraced | 4 | 2 | £995,000 | Sep 2023 | |
| 4 Galton Street, London, W10 4QN | house | 2 | - | £870,000 | Mar 2021 | |
| 21 Galton Street, London, W10 4QN | Terraced | 3 | - | £845,000 | Jan 2021 | |
| 19 Galton Street, London, W10 4QN | Terraced | 3 | 1 | £950,000 | Mar 2020 | |
| 7 Galton Street, London, W10 4QN | Terraced | 2 | - | £818,000 | Oct 2016 | |
| 9 Galton Street, London, W10 4QN | Terraced | 3 | 2 | £736,000 | Aug 2015 | |
| 17 Galton Street, London, W10 4QN | Terraced | 3 | 2 | £485,000 | Jul 2010 | |
| 14 Galton Street, London, W10 4QN | Terraced | - | - | £275,000 | Oct 2002 | |
| 6 Galton Street, London, W10 4QN | Terraced | 2 | 1 | £250,000 | Jun 2002 |
Page 1 of 3
Energy Efficiency in W10 4QN
Amenities
Schools
| Rank | School | Type | Entry gender | Ages |
|---|
Explore more schools in this area
Go to Schools tabDemographics
Household Size
One person
most common
Accommodation Type
Flats
most common
Tenure
17
majority
Ethnic Group
White
most common
Religion
N/A
most common
Household Composition
N/A
most common
Age
47
median
Adults (30-64 years)
most common
Household Deprivation
N/A
with no deprivation
NS-SEC
25
in Lower managerial occupations
Explore more demographic insights in this area
Go to Demographics tabPlanning
Planning Constraints
- Flood RiskPremium
- Ramsar Wetland SitesPremium
- Area of Outstanding Natural BeautyPremium
- Protected Nature ReservePremium
- Protected WoodlandPremium