Area Overview for SW7 3NS
Photos of SW7 3NS
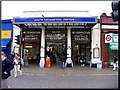
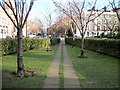
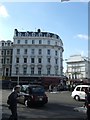
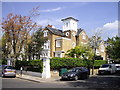
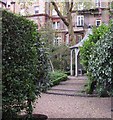
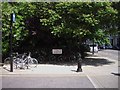
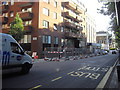
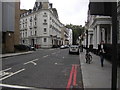
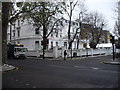
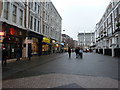
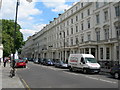
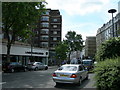
100 photos from this area
Area Information
Key information about the SW7 3NS including its size, population, and administrative classification.
- Area Type
- Postcode
- Area Size
- 4816 m²
- Population
- 1999
- Population Density
- 7136 people/km²
House Prices in SW7 3NS
37
Properties
£2,750,000
Average Sold Price
£2,750,000
Lowest Price
£2,750,000
Highest Price
Showing 37 properties
| Address | Type | Beds | Baths | Last Sale Price | Last Sale Date | |
|---|---|---|---|---|---|---|
| 42 Onslow Square, London, SW7 3NS | Flat | 1 | - | £2,750,000 | Oct 2002 | |
| Flat 10, 32 Onslow Square, London, SW7 3NS | Flat | 2 | 2 | - | - | |
| Flat 1, 24 Onslow Square, London, SW7 3NS | Flat | 2 | 2 | - | - | |
| Former Flat B, 38 Onslow Square, London, SW7 3NS | undefined | - | - | - | - | |
| Former Flat F, 38 Onslow Square, London, SW7 3NS | undefined | - | - | - | - | |
| Former Flat A, 38 Onslow Square, London, SW7 3NS | undefined | - | - | - | - | |
| Former Flat D, 38 Onslow Square, London, SW7 3NS | undefined | - | - | - | - | |
| Former Flat E, 38 Onslow Square, London, SW7 3NS | undefined | - | - | - | - | |
| Former Flat C, 38 Onslow Square, London, SW7 3NS | undefined | - | - | - | - | |
| Flat 2, 24 Onslow Square, London, SW7 3NS | Flat | - | - | - | - |
Page 1 of 4
Energy Efficiency in SW7 3NS
Amenities
Schools
| Rank | School | Type | Entry gender | Ages |
|---|
Explore more schools in this area
Go to Schools tabDemographics
Household Size
One person
most common
Accommodation Type
Flats
most common
Tenure
34
majority
Ethnic Group
White
most common
Religion
N/A
most common
Household Composition
N/A
most common
Age
47
median
Adults (30-64 years)
most common
Household Deprivation
N/A
with no deprivation
NS-SEC
54
in Lower managerial occupations
Explore more demographic insights in this area
Go to Demographics tabPlanning
Planning Constraints
- Flood RiskPremium
- Ramsar Wetland SitesPremium
- Area of Outstanding Natural BeautyPremium
- Protected Nature ReservePremium
- Protected WoodlandPremium