Area Overview for SW3 2LE
Photos of SW3 2LE
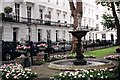
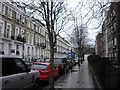
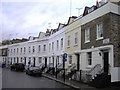
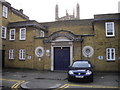
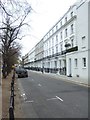
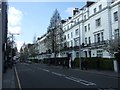
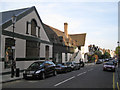
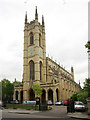


100 photos from this area
Area Information
Key information about the SW3 2LE including its size, population, and administrative classification.
- Area Type
- Postcode
- Area Size
- 2832 m²
- Population
- 1144
- Population Density
- 10288 people/km²
House Prices in SW3 2LE
29
Properties
£3,311,591
Average Sold Price
£770,000
Lowest Price
£16,000,000
Highest Price
Showing 29 properties
| Address | Type | Beds | Baths | Last Sale Price | Last Sale Date | |
|---|---|---|---|---|---|---|
| 25 Hasker Street, London, SW3 2LE | Terraced | 3 | 2 | £3,575,000 | Apr 2024 | |
| 55 Hasker Street, London, SW3 2LE | Terraced | 4 | 2 | £3,500,000 | Oct 2022 | |
| 23 Hasker Street, London, SW3 2LE | house | 3 | 2 | £3,650,000 | May 2022 | |
| 45 Hasker Street, London, SW3 2LE | house | 4 | 3 | £2,750,000 | Mar 2022 | |
| 49 Hasker Street, London, SW3 2LE | Terraced | 3 | 3 | £3,000,000 | Aug 2020 | |
| 3 Hasker Street, London, SW3 2LE | Terraced | 3 | 2 | £2,925,000 | Nov 2019 | |
| 1 Hasker Street, London, SW3 2LE | Terraced | 4 | 4 | £2,675,000 | May 2018 | |
| 31 Hasker Street, London, SW3 2LE | house | 3 | 2 | £3,300,000 | Apr 2018 | |
| 35 Hasker Street, London, SW3 2LE | house | - | - | £3,400,000 | Mar 2018 | |
| 51 Hasker Street, London, SW3 2LE | house | - | - | £3,250,000 | Sep 2017 |
Page 1 of 3
Energy Efficiency in SW3 2LE
Amenities
Schools
| Rank | School | Type | Entry gender | Ages |
|---|
Explore more schools in this area
Go to Schools tabDemographics
Household Size
One person
most common
Accommodation Type
Houses
most common
Tenure
44
majority
Ethnic Group
White
most common
Religion
N/A
most common
Household Composition
N/A
most common
Age
47
median
Adults (30-64 years)
most common
Household Deprivation
N/A
with no deprivation
NS-SEC
61
in Lower managerial occupations
Explore more demographic insights in this area
Go to Demographics tabPlanning
Planning Constraints
- Flood RiskPremium
- Ramsar Wetland SitesPremium
- Area of Outstanding Natural BeautyPremium
- Protected Nature ReservePremium
- Protected WoodlandPremium