Area Overview for South Tottenham Ward
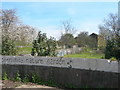
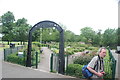
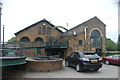
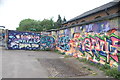
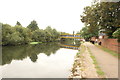
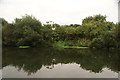
Photos of South Tottenham Ward


Area Information
South Tottenham Ward is a small but densely populated district within the London Borough of Haringey. You will find this ward situated in north London, covering an area of just 1.3 km². Nearly 3,770 people call this specific ward home, creating a tight-knit community where residents live close together. The location places you near the larger Tottenham area, positioned alongside neighbouring wards such as Tottenham Hale, Seven Sisters, Tottenham Central, and Bruce Castle. This ward operates under the governance of Haringey London Borough Council, which manages local services and planning decisions. While the ward was originally created in 1965, its boundaries have shifted over the decades. It was revised in 1978, abolished in 2002, and then recreated in 2022 to reflect current electoral requirements. Today, the ward elects councillors to the local council, with Labour holding all seats following the 2022 election. Living in South Tottenham Ward means you are part of a historically significant electoral unit that plays a key role in the local political landscape of Haringey.
- Area Type
- District Borough Unitary Ward
- Area Size
- 1.3 km²
- Population
- 3770
- Population Density
- 2924 people/km²
Demographics
The community in South Tottenham Ward is defined by a very elderly population. The median age here is 70, which indicates that half of all residents are older than this age. You are more likely to encounter retirees than young families or working professionals in this specific ward. The 2021 census records a population of 16,821 when covering the broader area associated with the ward, though your specific ward unit holds 3,770 residents. Home ownership is relatively low compared to the national average, with only 28% of households owning their property outright or with a mortgage. This suggests a significant portion of the community relies on renting accommodation. The ward covers a total area of 1.3 km², supporting this population at a density of 2,924 people per square kilometre. This high density combined with the age profile paints a picture of a mature neighbourhood where services are geared towards older demographics. Historical political shifts, such as the boundary changes in 2022, ensure that voting patterns reflect these specific demographic realities within the Haringey borough.
Household Size
Accommodation Type
Tenure
Ethnic Group
Religion
Household Composition
Age
Household Deprivation
NS-SEC
Explore more demographic insights in this area
Go to Demographics tabPlanning
Planning Constraints
- Flood RiskPremium
- Ramsar Wetland SitesPremium
- Area of Outstanding Natural BeautyPremium
- Protected Nature ReservePremium
- Protected WoodlandPremium
- Crime RiskPremium