Area Overview for SE9 5NY
Photos of SE9 5NY
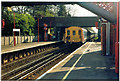
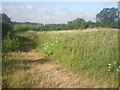
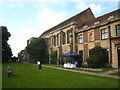
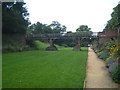
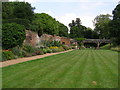
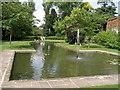
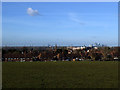
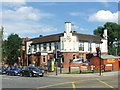
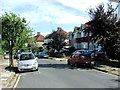
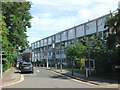
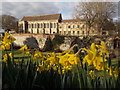
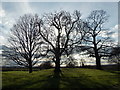
100 photos from this area
Area Information
Key information about the SE9 5NY including its size, population, and administrative classification.
- Area Type
- Postcode
- Area Size
- 2.3 hectares
- Population
- 1991
- Population Density
- 2085 people/km²
House Prices in SE9 5NY
21
Properties
£208,250
Average Sold Price
£68,000
Lowest Price
£383,000
Highest Price
Showing 21 properties
| Address | Type | Beds | Baths | Last Sale Price | Last Sale Date | |
|---|---|---|---|---|---|---|
| 2 Tarnwood Park, Mottingham, SE9 5NY | Maisonette | 3 | 1 | £383,000 | Dec 2024 | |
| 11 Tarnwood Park, Mottingham, SE9 5NY | Maisonette | 3 | 1 | £315,000 | Nov 2022 | |
| 10 Tarnwood Park, Mottingham, SE9 5NY | Maisonette | 3 | 1 | £345,000 | Nov 2022 | |
| 19 Tarnwood Park, Mottingham, SE9 5NY | Flat | - | - | £275,000 | May 2022 | |
| 8 Tarnwood Park, Mottingham, SE9 5NY | Maisonette | 3 | 1 | £260,000 | Jun 2014 | |
| 3 Tarnwood Park, Mottingham, SE9 5NY | Flat | 3 | 2 | £210,000 | Feb 2014 | |
| 7 Tarnwood Park, Mottingham, SE9 5NY | Maisonette | 3 | 2 | £192,500 | Feb 2013 | |
| 16 Tarnwood Park, Mottingham, SE9 5NY | Flat | 4 | - | £199,000 | Aug 2012 | |
| 9 Tarnwood Park, Mottingham, SE9 5NY | Flat | 3 | - | £205,000 | Jan 2008 | |
| 20 Tarnwood Park, Mottingham, SE9 5NY | Flat | - | - | £184,000 | Sep 2007 |
Page 1 of 3
Energy Efficiency in SE9 5NY
Amenities
Schools
| Rank | School | Type | Entry gender | Ages |
|---|
Explore more schools in this area
Go to Schools tabDemographics
Household Size
One person
most common
Accommodation Type
Flats
most common
Tenure
45
majority
Ethnic Group
White
most common
Religion
N/A
most common
Household Composition
N/A
most common
Age
47
median
Adults (30-64 years)
most common
Household Deprivation
N/A
with no deprivation
NS-SEC
41
in Lower managerial occupations
Explore more demographic insights in this area
Go to Demographics tabPlanning
Planning Constraints
- Flood RiskPremium
- Ramsar Wetland SitesPremium
- Area of Outstanding Natural BeautyPremium
- Protected Nature ReservePremium
- Protected WoodlandPremium