Area Overview for SE26 5EW
Photos of SE26 5EW
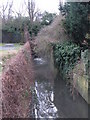
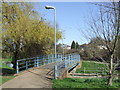
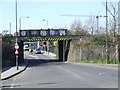
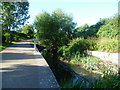
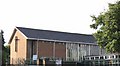
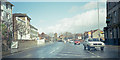
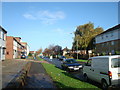
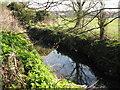
100 photos from this area
Area Information
Key information about the SE26 5EW including its size, population, and administrative classification.
- Area Type
- Postcode
- Area Size
- 4131 m²
- Population
- 1535
- Population Density
- 12212 people/km²
House Prices in SE26 5EW
39
Properties
£263,333
Average Sold Price
£135,000
Lowest Price
£395,000
Highest Price
Showing 39 properties
| Address | Type | Beds | Baths | Last Sale Price | Last Sale Date | |
|---|---|---|---|---|---|---|
| 287A Sydenham Road, London, SE26 5EW | Flat | 2 | 2 | £395,000 | Oct 2018 | |
| 313A Sydenham Road, London, SE26 5EW | Flat | - | - | £260,000 | Jul 2015 | |
| 311A Sydenham Road, London, SE26 5EW | Maisonette | 3 | 1 | £135,000 | Sep 2007 | |
| 287C Sydenham Road, London, SE26 5EW | Flat | 2 | 2 | - | - | |
| 307 Sydenham Road, London, SE26 5EW | Flat | 2 | 1 | - | - | |
| 297 Sydenham Road, London, SE26 5EW | Flat | 2 | - | - | - | |
| 317A Sydenham Road, London, SE26 5EW | Flat | - | - | - | - | |
| Flat 2, 315A Sydenham Road, London, SE26 5EW | Flat | - | - | - | - | |
| Flat 3, 315A Sydenham Road, London, SE26 5EW | Flat | - | - | - | - | |
| Flat 1, 315A Sydenham Road, London, SE26 5EW | Flat | - | - | - | - |
Page 1 of 4
Energy Efficiency in SE26 5EW
Amenities
Schools
| Rank | School | Type | Entry gender | Ages |
|---|
Explore more schools in this area
Go to Schools tabDemographics
Household Size
Family (3-5 people)
most common
Accommodation Type
Houses
most common
Tenure
52
majority
Ethnic Group
White
most common
Religion
N/A
most common
Household Composition
N/A
most common
Age
47
median
Adults (30-64 years)
most common
Household Deprivation
N/A
with no deprivation
NS-SEC
40
in Lower managerial occupations
Explore more demographic insights in this area
Go to Demographics tabPlanning
Planning Constraints
- Flood RiskPremium
- Ramsar Wetland SitesPremium
- Area of Outstanding Natural BeautyPremium
- Protected Nature ReservePremium
- Protected WoodlandPremium