Area Overview for SE17 1ED
Photos of SE17 1ED
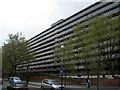
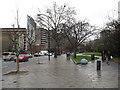


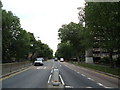
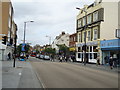
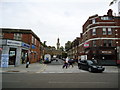
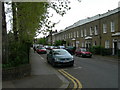
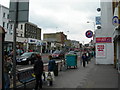
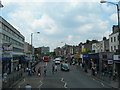

100 photos from this area
Area Information
Key information about the SE17 1ED including its size, population, and administrative classification.
- Area Type
- Postcode
- Area Size
- 1652 m²
- Population
- 1718
- Population Density
- 28923 people/km²
House Prices in SE17 1ED
46
Properties
£230,577
Average Sold Price
£70,000
Lowest Price
£350,000
Highest Price
Showing 46 properties
| Address | Type | Beds | Baths | Last Sale Price | Last Sale Date | |
|---|---|---|---|---|---|---|
| 30, Nicholson House Browning Estate, Brandon Street, London, SE17 1ED | Flat | - | - | £315,000 | Feb 2024 | |
| 35, Nicholson House Browning Estate, Brandon Street, London, SE17 1ED | Flat | 2 | 1 | £350,000 | Feb 2023 | |
| 40, Nicholson House Browning Estate, Brandon Street, London, SE17 1ED | Flat | 1 | 1 | £307,000 | May 2022 | |
| 31, Nicholson House Browning Estate, Brandon Street, London, SE17 1ED | Flat | - | - | £290,000 | May 2021 | |
| 13, Nicholson House Browning Estate, Brandon Street, London, SE17 1ED | Flat | 1 | 1 | £276,000 | Dec 2019 | |
| 26, Nicholson House Browning Estate, Brandon Street, London, SE17 1ED | Flat | - | - | £320,000 | Jan 2019 | |
| 24, Nicholson House Browning Estate, Brandon Street, London, SE17 1ED | Flat | - | - | £250,000 | Jan 2013 | |
| 18, Nicholson House Browning Estate, Brandon Street, London, SE17 1ED | Flat | 2 | 1 | £225,000 | Jan 2013 | |
| 25, Nicholson House Browning Estate, Brandon Street, London, SE17 1ED | Flat | - | - | £175,000 | Dec 2005 | |
| 15, Nicholson House Browning Estate, Brandon Street, London, SE17 1ED | Flat | - | - | £136,000 | Dec 2002 |
Page 1 of 5
Energy Efficiency in SE17 1ED
Amenities
Schools
| Rank | School | Type | Entry gender | Ages |
|---|
Explore more schools in this area
Go to Schools tabDemographics
Household Size
Family (3-5 people)
most common
Accommodation Type
Flats
most common
Tenure
13
majority
Ethnic Group
black_total
most common
Religion
N/A
most common
Household Composition
N/A
most common
Age
47
median
Adults (30-64 years)
most common
Household Deprivation
N/A
with no deprivation
NS-SEC
25
in Lower managerial occupations
Explore more demographic insights in this area
Go to Demographics tabPlanning
Planning Constraints
- Flood RiskPremium
- Ramsar Wetland SitesPremium
- Area of Outstanding Natural BeautyPremium
- Protected Nature ReservePremium
- Protected WoodlandPremium