Area Overview for Palace & Hurlingham Ward
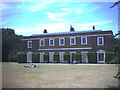
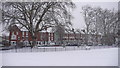
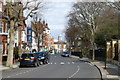
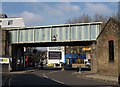
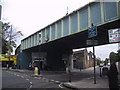
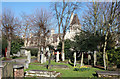
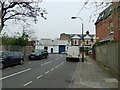
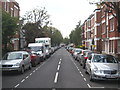
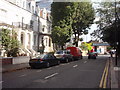
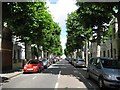
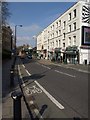
Photos of Palace & Hurlingham Ward

Area Information
Living in Palace & Hurlingham Ward offers a distinctly quiet existence within the London borough of Hammersmith and Fulham. This district covers a compact footprint of just 1.9 square kilometres yet houses a small population of 1,224 residents. Such low density creates an environment that feels separate from the noise of the wider borough. The ward stands apart from the more commercial areas of Hammersmith while remaining firmly within the Greater London context. Daily life here revolves around proximity to green spaces and the need to commute for work, as the ward itself contains very few commercial retail outlets. You will find that the community moves at a slower pace compared to neighbouring districts. The area's size ensures that traffic congestion is rarely a daily obstacle for local residents. However, the geography means you must travel to access most major amenities. Prospective buyers viewing homes in Palace & Hurlingham Ward should note the profound demographic character that defines the streets. This is not a young family area; rather, it is a retirement destination. Compelling evidence of this shift is found in the age profile, which indicates a median age of 70 years. You will notice a neighbourhood populated predominantly by seniors rather than children or young professionals. This demographic concentration shapes the local economy and the upkeep of the housing stock. The small population spread over a tiny area results in low pressure on local infrastructure. Yet, the lack of local shops affects daily convenience. Residents often rely on larger hubs in neighbouring zones for grocery stores and leisure activities. Understanding this context is vital before committing to a purchase in this specific ward.
- Area Type
- District Borough Unitary Ward
- Area Size
- 1.9 km²
- Population
- 1224
- Population Density
- 642 people/km²
Demographics
The community within Palace & Hurlingham Ward reflects a very specific life stage, defined by an ageing population. The median age of residents is exactly 70 years, a figure that clearly signals this is an area for retirement living rather than family rearing. You will not find many young children playing on the streets, as the household composition is tailored to older adults.的四分之一 of the population falls into the standard adult categories, but the overwhelming majority belong to the senior brackets. Home ownership rates stand at 48 per cent, meaning slightly fewer than half of the households own their freehold or leasehold properties outright. The remaining residents likely rent their accommodation, creating a mix of owner-occupied and private or social rental sectors. This balance influences how much direct control residents have over their immediate surroundings. Ethnic and religious diversity statistics are not detailed in the available figures, so the social fabric appears homogeneous in its current recorded data. The population density of 642 people per square kilometre confirms a comfortable, uncrowded living standard. This density is roughly one-third of the London average, ensuring ample personal space in homes and gardens. The household types are likely skewed towards single-occupancy or couple-based arrangements, fitting the high median age. If you are considering buying homes in this area, expect to join a community accustomed to quiet, if you prefer a bustling, youth-centric environment. The demographic reality means local events and services are likely curated towards the needs of the elderly, such as specific health screenings or social clubs. You should verify whether these amenities align with your lifestyle requirements before viewing properties here.
Household Size
Accommodation Type
Tenure
Ethnic Group
Religion
Household Composition
Age
Household Deprivation
NS-SEC
Explore more demographic insights in this area
Go to Demographics tabPlanning
Planning Constraints
- Flood RiskPremium
- Ramsar Wetland SitesPremium
- Area of Outstanding Natural BeautyPremium
- Protected Nature ReservePremium
- Protected WoodlandPremium
- Crime RiskPremium