Area Overview for NW1 3RB
Photos of NW1 3RB
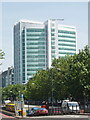
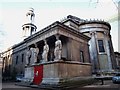
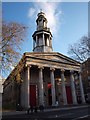
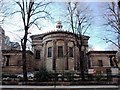
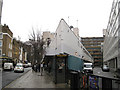
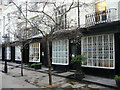
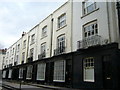
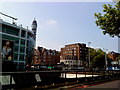
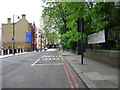
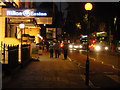
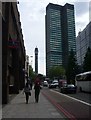
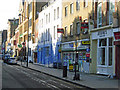
100 photos from this area
Area Information
Key information about the NW1 3RB including its size, population, and administrative classification.
- Area Type
- Postcode
- Area Size
- 2882 m²
- Population
- 2576
- Population Density
- 7599 people/km²
House Prices in NW1 3RB
No properties found in this postcode.
Energy Efficiency in NW1 3RB
Amenities
Schools
| Rank | School | Type | Entry gender | Ages |
|---|---|---|---|---|
| 1 | Camden Primary Pupil Referral Unit | other | N/A | N/A |
| 2 | Netley Primary School & Centre for Autism | primary | N/A | N/A |
Explore more schools in this area
Go to Schools tabDemographics
Household Size
Family (3-5 people)
most common
Accommodation Type
Flats
most common
Tenure
13
majority
Ethnic Group
White
most common
Religion
N/A
most common
Household Composition
N/A
most common
Age
22
median
Young Adults (15-29 years)
most common
Household Deprivation
N/A
with no deprivation
NS-SEC
19
in Lower managerial occupations
Explore more demographic insights in this area
Go to Demographics tabPlanning
Planning Constraints
- Flood RiskPremium
- Ramsar Wetland SitesPremium
- Area of Outstanding Natural BeautyPremium
- Protected Nature ReservePremium
- Protected WoodlandPremium
- Crime RiskPremium