Area Overview for N7 9ET
Photos of N7 9ET
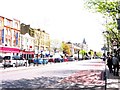
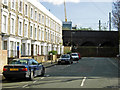
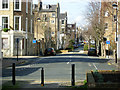
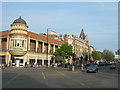
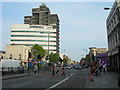
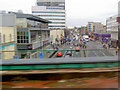
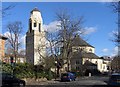
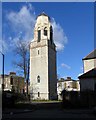
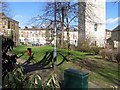
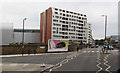
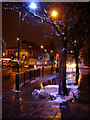
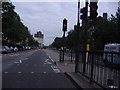
100 photos from this area
Area Information
Key information about the N7 9ET including its size, population, and administrative classification.
- Area Type
- Postcode
- Area Size
- 6326 m²
- Population
- 2180
- Population Density
- 15947 people/km²
House Prices in N7 9ET
53
Properties
£346,917
Average Sold Price
£163,000
Lowest Price
£495,000
Highest Price
Showing 53 properties
| Address | Type | Beds | Baths | Last Sale Price | Last Sale Date | |
|---|---|---|---|---|---|---|
| 37 Corporation Street, London, N7 9ET | Flat | 1 | 1 | £350,000 | Nov 2024 | |
| 49 Corporation Street, London, N7 9ET | Flat | 2 | 1 | £480,000 | Jun 2024 | |
| 13 Corporation Street, London, N7 9ET | Flat | 2 | 2 | £495,000 | Sep 2023 | |
| 31 Corporation Street, London, N7 9ET | Maisonette | 2 | 1 | £450,000 | Dec 2020 | |
| 75 Corporation Street, London, N7 9ET | house | - | - | £455,000 | Jun 2015 | |
| 83 Corporation Street, London, N7 9ET | Terraced | 3 | - | £385,000 | Oct 2013 | |
| 99 Corporation Street, London, N7 9ET | Terraced | 6 | 2 | £355,000 | Jun 2013 | |
| 65 Corporation Street, London, N7 9ET | Maisonette | 2 | 1 | £249,999 | Oct 2011 | |
| 59 Corporation Street, London, N7 9ET | Flat | - | - | £175,000 | May 2009 | |
| 95 Corporation Street, London, N7 9ET | Terraced | 5 | 1 | £320,000 | Aug 2007 |
Page 1 of 6
Energy Efficiency in N7 9ET
Amenities
Schools
| Rank | School | Type | Entry gender | Ages |
|---|
Explore more schools in this area
Go to Schools tabDemographics
Household Size
One person
most common
Accommodation Type
Flats
most common
Tenure
19
majority
Ethnic Group
White
most common
Religion
N/A
most common
Household Composition
N/A
most common
Age
47
median
Adults (30-64 years)
most common
Household Deprivation
N/A
with no deprivation
NS-SEC
33
in Lower managerial occupations
Explore more demographic insights in this area
Go to Demographics tabPlanning
Planning Constraints
- Flood RiskPremium
- Ramsar Wetland SitesPremium
- Area of Outstanding Natural BeautyPremium
- Protected Nature ReservePremium
- Protected WoodlandPremium