Area Overview for N3 1JD
Photos of N3 1JD
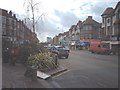


100 photos from this area
Area Information
Key information about the N3 1JD including its size, population, and administrative classification.
- Area Type
- Postcode
- Area Size
- 6198 m²
- Population
- 1502
- Population Density
- 6938 people/km²
House Prices in N3 1JD
38
Properties
£371,650
Average Sold Price
£129,950
Lowest Price
£500,000
Highest Price
Showing 38 properties
| Address | Type | Beds | Baths | Last Sale Price | Last Sale Date | |
|---|---|---|---|---|---|---|
| 200 Nether Street, Ballards Lane To Dollis Road, London, N3 1JD | Detached | 3 | 2 | £500,000 | Jun 2019 | |
| 206 Nether Street, Ballards Lane To Dollis Road, London, N3 1JD | house | 4 | - | £485,000 | Sep 2012 | |
| Flat D, 220 Nether Street, Ballards Lane To Dollis Road, London, N3 1JD | Flat | - | - | £129,950 | Aug 1998 | |
| Flat 3, Katherine Lodge, 218 Nether Street, Ballards Lane To Dollis Road, London, N3 1JD | Flat | 2 | 1 | - | - | |
| Flat 4, 222 Nether Street, Ballards Lane To Dollis Road, London, N3 1JD | Flat | 2 | 2 | - | - | |
| 220A Nether Street, Ballards Lane To Dollis Road, London, N3 1JD | Flat | 1 | 1 | - | - | |
| Flat 3, 202 Nether Street, Ballards Lane To Dollis Road, London, N3 1JD | Flat | 2 | 2 | - | - | |
| Flat 2, 202 Nether Street, Ballards Lane To Dollis Road, London, N3 1JD | Flat | 2 | 2 | - | - | |
| Flat 1, 202 Nether Street, Ballards Lane To Dollis Road, London, N3 1JD | Flat | 6 | 2 | - | - | |
| 220D Nether Street, Ballards Lane To Dollis Road, London, N3 1JD | Flat | 2 | 2 | - | - |
Page 1 of 4
Energy Efficiency in N3 1JD
Amenities
Schools
| Rank | School | Type | Entry gender | Ages |
|---|
Explore more schools in this area
Go to Schools tabDemographics
Household Size
Family (3-5 people)
most common
Accommodation Type
Houses
most common
Tenure
69
majority
Ethnic Group
White
most common
Religion
N/A
most common
Household Composition
N/A
most common
Age
47
median
Adults (30-64 years)
most common
Household Deprivation
N/A
with no deprivation
NS-SEC
51
in Lower managerial occupations
Explore more demographic insights in this area
Go to Demographics tabPlanning
Planning Constraints
- Flood RiskPremium
- Ramsar Wetland SitesPremium
- Area of Outstanding Natural BeautyPremium
- Protected Nature ReservePremium
- Protected WoodlandPremium