Area Overview for N20 9HR
Photos of N20 9HR
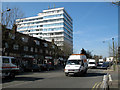
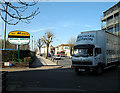
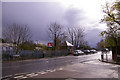
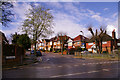
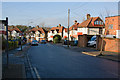
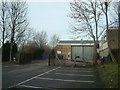

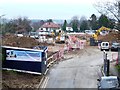
77 photos from this area
Area Information
Key information about the N20 9HR including its size, population, and administrative classification.
- Area Type
- Postcode
- Area Size
- 6903 m²
- Population
- 1789
- Population Density
- 6646 people/km²
House Prices in N20 9HR
46
Properties
£312,929
Average Sold Price
£187,000
Lowest Price
£390,000
Highest Price
Showing 46 properties
| Address | Type | Beds | Baths | Last Sale Price | Last Sale Date | |
|---|---|---|---|---|---|---|
| 1307 High Road, Whetstone, London, N20 9HR | Flat | 2 | 1 | £340,000 | May 2025 | |
| 1309 High Road, Whetstone, London, N20 9HR | Flat | 2 | 1 | £343,000 | Mar 2025 | |
| 1313 High Road, Whetstone, London, N20 9HR | Flat | 2 | 1 | £390,000 | Nov 2023 | |
| 1319 High Road, Whetstone, London, N20 9HR | Flat | - | - | £375,000 | Aug 2022 | |
| 1311 High Road, Whetstone, London, N20 9HR | Flat | - | - | £368,500 | Aug 2021 | |
| 1317 High Road, Whetstone, London, N20 9HR | Flat | - | - | £187,000 | Jun 2004 | |
| 1321 High Road, Whetstone, London, N20 9HR | Flat | - | - | £187,000 | Oct 2002 | |
| Flat 4, Walsingham House, 1331 High Road, Whetstone, London, N20 9HR | Flat | 2 | 2 | - | - | |
| Flat 15, Walsingham House, 1331 High Road, Whetstone, London, N20 9HR | Flat | 2 | 2 | - | - | |
| Flat 12, Walsingham House, 1331 High Road, Whetstone, London, N20 9HR | Flat | 1 | 1 | - | - |
Page 1 of 5
Energy Efficiency in N20 9HR
Amenities
Schools
| Rank | School | Type | Entry gender | Ages |
|---|
Explore more schools in this area
Go to Schools tabDemographics
Household Size
One person
most common
Accommodation Type
Flats
most common
Tenure
69
majority
Ethnic Group
White
most common
Religion
N/A
most common
Household Composition
N/A
most common
Age
47
median
Adults (30-64 years)
most common
Household Deprivation
N/A
with no deprivation
NS-SEC
58
in Lower managerial occupations
Explore more demographic insights in this area
Go to Demographics tabPlanning
Planning Constraints
- Flood RiskPremium
- Ramsar Wetland SitesPremium
- Area of Outstanding Natural BeautyPremium
- Protected Nature ReservePremium
- Protected WoodlandPremium