Area Overview for N17 0EX
Photos of N17 0EX
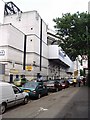

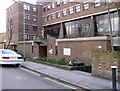


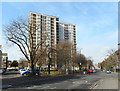

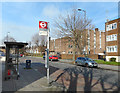


53 photos from this area
Area Information
Key information about the N17 0EX including its size, population, and administrative classification.
- Area Type
- Postcode
- Area Size
- 1.6 hectares
- Population
- 1864
- Population Density
- 10869 people/km²
House Prices in N17 0EX
91
Properties
£248,673
Average Sold Price
£64,000
Lowest Price
£485,000
Highest Price
Showing 91 properties
| Address | Type | Beds | Baths | Last Sale Price | Last Sale Date | |
|---|---|---|---|---|---|---|
| 52 Coniston Road, Tottenham, London, N17 0EX | Terraced | 3 | 1 | £485,000 | May 2022 | |
| 19 Coniston Road, Tottenham, London, N17 0EX | Terraced | 3 | 1 | £420,000 | Jun 2021 | |
| 21 Coniston Road, Tottenham, London, N17 0EX | Terraced | 3 | 1 | £342,626 | Apr 2021 | |
| 29 Coniston Road, Tottenham, London, N17 0EX | Terraced | 3 | 1 | £476,000 | Oct 2018 | |
| 38 Coniston Road, Tottenham, London, N17 0EX | Terraced | - | - | £447,000 | Apr 2018 | |
| 40 Coniston Road, Tottenham, London, N17 0EX | Terraced | 4 | 1 | £375,000 | May 2016 | |
| 60 Coniston Road, Tottenham, London, N17 0EX | Terraced | 4 | 1 | £430,000 | Nov 2015 | |
| 25 Coniston Road, Tottenham, London, N17 0EX | Terraced | 4 | 1 | £345,000 | May 2015 | |
| 54 Coniston Road, Tottenham, London, N17 0EX | Terraced | 3 | 1 | £350,000 | Jan 2015 | |
| 56 Coniston Road, Tottenham, London, N17 0EX | Terraced | 3 | 1 | £305,000 | Dec 2014 |
Page 1 of 10
Energy Efficiency in N17 0EX
Amenities
Schools
| Rank | School | Type | Entry gender | Ages |
|---|
Explore more schools in this area
Go to Schools tabDemographics
Household Size
Family (3-5 people)
most common
Accommodation Type
Flats
most common
Tenure
30
majority
Ethnic Group
black_total
most common
Religion
N/A
most common
Household Composition
N/A
most common
Age
47
median
Adults (30-64 years)
most common
Household Deprivation
N/A
with no deprivation
NS-SEC
16
in Lower managerial occupations
Explore more demographic insights in this area
Go to Demographics tabPlanning
Planning Constraints
- Flood RiskPremium
- Ramsar Wetland SitesPremium
- Area of Outstanding Natural BeautyPremium
- Protected Nature ReservePremium
- Protected WoodlandPremium