Area Overview for N15 4FN
Photos of N15 4FN
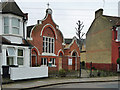
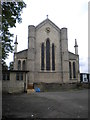
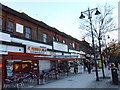
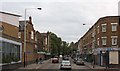
100 photos from this area
Area Information
Key information about the N15 4FN including its size, population, and administrative classification.
- Area Type
- Postcode
- Area Size
- 8780 m²
- Population
- 2611
- Population Density
- 13254 people/km²
House Prices in N15 4FN
60
Properties
£269,250
Average Sold Price
£122,500
Lowest Price
£380,000
Highest Price
Showing 60 properties
| Address | Type | Beds | Baths | Last Sale Price | Last Sale Date | |
|---|---|---|---|---|---|---|
| 52 Isobel Place, Tottenham, London, N15 4FN | Flat | 1 | 1 | £335,000 | Mar 2025 | |
| 54 Isobel Place, Tottenham, London, N15 4FN | Flat | - | - | £380,000 | Jun 2021 | |
| 56 Isobel Place, Tottenham, London, N15 4FN | Flat | 1 | 1 | £166,000 | Nov 2020 | |
| 57 Isobel Place, Tottenham, London, N15 4FN | Flat | - | - | £330,000 | Oct 2019 | |
| 46 Isobel Place, Tottenham, London, N15 4FN | Flat | - | - | £375,000 | Feb 2019 | |
| 53 Isobel Place, Tottenham, London, N15 4FN | Flat | 1 | 1 | £176,250 | Aug 2018 | |
| 50 Isobel Place, Tottenham, London, N15 4FN | Flat | 1 | 1 | £122,500 | Oct 2017 | |
| 18 Isobel Place, Tottenham, London, N15 4FN | Flat | 1 | 1 | - | - | |
| 55 Isobel Place, Tottenham, London, N15 4FN | Flat | 2 | 1 | - | - | |
| 22 Isobel Place, Tottenham, London, N15 4FN | Flat | 1 | 1 | - | - |
Page 1 of 6
Energy Efficiency in N15 4FN
Amenities
Schools
| Rank | School | Type | Entry gender | Ages |
|---|
Explore more schools in this area
Go to Schools tabDemographics
Household Size
Family (3-5 people)
most common
Accommodation Type
Flats
most common
Tenure
19
majority
Ethnic Group
black_total
most common
Religion
N/A
most common
Household Composition
N/A
most common
Age
47
median
Adults (30-64 years)
most common
Household Deprivation
N/A
with no deprivation
NS-SEC
21
in Lower managerial occupations
Explore more demographic insights in this area
Go to Demographics tabPlanning
Planning Constraints
- Flood RiskPremium
- Ramsar Wetland SitesPremium
- Area of Outstanding Natural BeautyPremium
- Protected Nature ReservePremium
- Protected WoodlandPremium