Area Overview for N10 3SU
Photos of N10 3SU


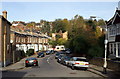

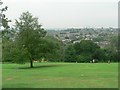
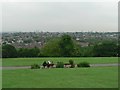
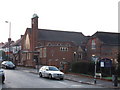

100 photos from this area
Area Information
Key information about the N10 3SU including its size, population, and administrative classification.
- Area Type
- Postcode
- Area Size
- 1.6 hectares
- Population
- 1546
- Population Density
- 5280 people/km²
House Prices in N10 3SU
32
Properties
£634,750
Average Sold Price
£80,000
Lowest Price
£1,610,000
Highest Price
Showing 32 properties
| Address | Type | Beds | Baths | Last Sale Price | Last Sale Date | |
|---|---|---|---|---|---|---|
| 16 Springfield Avenue, Hornsey, London, N10 3SU | Maisonette | 4 | 2 | £1,200,000 | Aug 2023 | |
| 14 Springfield Avenue, Hornsey, London, N10 3SU | Flat | - | - | £660,000 | Oct 2020 | |
| 5 Springfield Avenue, Hornsey, London, N10 3SU | Maisonette | 2 | 1 | £80,000 | Nov 2019 | |
| 3 Springfield Avenue, Hornsey, London, N10 3SU | Flat | 3 | 1 | £800,000 | Nov 2018 | |
| 6 Springfield Avenue, Hornsey, London, N10 3SU | Maisonette | 4 | 2 | £865,000 | Apr 2018 | |
| 29 Springfield Avenue, Hornsey, London, N10 3SU | Maisonette | - | - | £1,055,000 | Oct 2016 | |
| 1 Springfield Avenue, Hornsey, London, N10 3SU | Maisonette | 2 | 1 | £755,000 | Aug 2016 | |
| 33 Springfield Avenue, Hornsey, London, N10 3SU | Detached | 5 | - | £1,610,000 | Jan 2014 | |
| 25 Springfield Avenue, Hornsey, London, N10 3SU | Maisonette | - | - | £540,000 | Jan 2013 | |
| 23 Springfield Avenue, Hornsey, London, N10 3SU | Flat | 2 | 1 | £500,000 | Oct 2012 |
Page 1 of 4
Energy Efficiency in N10 3SU
Amenities
Schools
| Rank | School | Type | Entry gender | Ages |
|---|
Explore more schools in this area
Go to Schools tabDemographics
Household Size
One person
most common
Accommodation Type
Flats
most common
Tenure
50
majority
Ethnic Group
White
most common
Religion
N/A
most common
Household Composition
N/A
most common
Age
47
median
Adults (30-64 years)
most common
Household Deprivation
N/A
with no deprivation
NS-SEC
55
in Lower managerial occupations
Explore more demographic insights in this area
Go to Demographics tabPlanning
Planning Constraints
- Flood RiskPremium
- Ramsar Wetland SitesPremium
- Area of Outstanding Natural BeautyPremium
- Protected Nature ReservePremium
- Protected WoodlandPremium