Area Overview for N10 1HU
Photos of N10 1HU
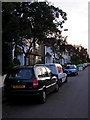
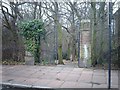
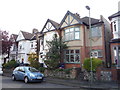
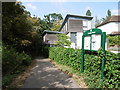
42 photos from this area
Area Information
Key information about the N10 1HU including its size, population, and administrative classification.
- Area Type
- Postcode
- Area Size
- 10.7 hectares
- Population
- 2683
- Population Density
- 6417 people/km²
House Prices in N10 1HU
60
Properties
£467,780
Average Sold Price
£81,000
Lowest Price
£890,000
Highest Price
Showing 60 properties
| Address | Type | Beds | Baths | Last Sale Price | Last Sale Date | |
|---|---|---|---|---|---|---|
| 15 Barrenger Road, Hornsey, London, N10 1HU | Terraced | 4 | 1 | £780,000 | Dec 2025 | |
| 69 Barrenger Road, Hornsey, London, N10 1HU | Terraced | 3 | 1 | £770,000 | Jun 2025 | |
| 13 Barrenger Road, Hornsey, London, N10 1HU | Terraced | 4 | 1 | £730,000 | Feb 2025 | |
| 57 Barrenger Road, Hornsey, London, N10 1HU | Terraced | 3 | 1 | £890,000 | Aug 2024 | |
| 95 Barrenger Road, Hornsey, London, N10 1HU | Terraced | 3 | 1 | £675,000 | Aug 2023 | |
| 111 Barrenger Road, Hornsey, London, N10 1HU | Terraced | 2 | 1 | £550,000 | Apr 2023 | |
| 61 Barrenger Road, Hornsey, London, N10 1HU | Terraced | 3 | 1 | £663,000 | Aug 2021 | |
| 97 Barrenger Road, Hornsey, London, N10 1HU | Terraced | 2 | 1 | £600,000 | Jun 2021 | |
| 93 Barrenger Road, Hornsey, London, N10 1HU | Terraced | 2 | 1 | £490,000 | Aug 2016 | |
| 29 Barrenger Road, Hornsey, London, N10 1HU | Terraced | 2 | - | £500,000 | Jul 2016 |
Page 1 of 6
Energy Efficiency in N10 1HU
Amenities
Schools
| Rank | School | Type | Entry gender | Ages |
|---|
Explore more schools in this area
Go to Schools tabDemographics
Household Size
Family (3-5 people)
most common
Accommodation Type
Houses
most common
Tenure
50
majority
Ethnic Group
White
most common
Religion
N/A
most common
Household Composition
N/A
most common
Age
47
median
Adults (30-64 years)
most common
Household Deprivation
N/A
with no deprivation
NS-SEC
39
in Lower managerial occupations
Explore more demographic insights in this area
Go to Demographics tabPlanning
Planning Constraints
- Flood RiskPremium
- Ramsar Wetland SitesPremium
- Area of Outstanding Natural BeautyPremium
- Protected Nature ReservePremium
- Protected WoodlandPremium