Area Overview for N10 1BY
Photos of N10 1BY
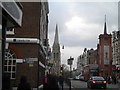
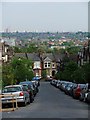
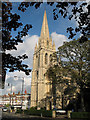
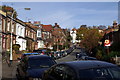
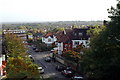
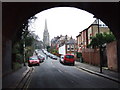
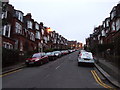
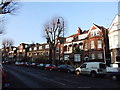
100 photos from this area
Area Information
Key information about the N10 1BY including its size, population, and administrative classification.
- Area Type
- Postcode
- Area Size
- 2054 m²
- Population
- 1782
- Population Density
- 9345 people/km²
House Prices in N10 1BY
15
Properties
-
Average Sold Price
-
Lowest Price
-
Highest Price
Showing 15 properties
| Address | Type | Beds | Baths | Last Sale Price | Last Sale Date | |
|---|---|---|---|---|---|---|
| Flat, 299 Muswell Hill Broadway, Hornsey, London, N10 1BY | Flat | - | - | - | - | |
| 333 Muswell Hill Broadway, Hornsey, London, N10 1BY | Retail | 2 | 2 | - | - | |
| Flat B, 291 Muswell Hill Broadway, Hornsey, London, N10 1BY | Flat | - | - | - | - | |
| Flat C, 291 Muswell Hill Broadway, Hornsey, London, N10 1BY | Flat | - | - | - | - | |
| 289 Muswell Hill Broadway, Hornsey, London, N10 1BY | Terraced | - | - | - | - | |
| La'de Kitchen, 291-293 Muswell Hill Broadway, Hornsey, London, N10 1BY | restaurant_cafe | - | - | - | - | |
| 329 Muswell Hill Broadway, Hornsey, London, N10 1BY | Terraced | - | - | - | - | |
| 331 Muswell Hill Broadway, Hornsey, London, N10 1BY | Flat | - | - | - | - | |
| First Floor Left Flat, 315 Muswell Hill Broadway, Hornsey, London, N10 1BY | Flat | 1 | 1 | - | - | |
| Second Floor Right Flat, 321 Muswell Hill Broadway, Hornsey, London, N10 1BY | Flat | 1 | 1 | - | - |
Page 1 of 2
Energy Efficiency in N10 1BY
Amenities
Schools
| Rank | School | Type | Entry gender | Ages |
|---|
Explore more schools in this area
Go to Schools tabDemographics
Household Size
Two person
most common
Accommodation Type
Flats
most common
Tenure
46
majority
Ethnic Group
White
most common
Religion
N/A
most common
Household Composition
N/A
most common
Age
47
median
Adults (30-64 years)
most common
Household Deprivation
N/A
with no deprivation
NS-SEC
49
in Lower managerial occupations
Explore more demographic insights in this area
Go to Demographics tabPlanning
Planning Constraints
- Flood RiskPremium
- Ramsar Wetland SitesPremium
- Area of Outstanding Natural BeautyPremium
- Protected Nature ReservePremium
- Protected WoodlandPremium