Area Overview for N1 2AL
Photos of N1 2AL
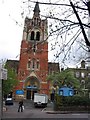
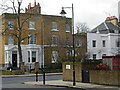
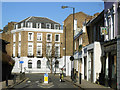
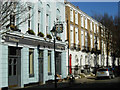
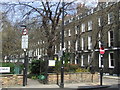
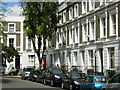
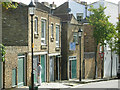
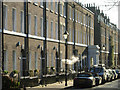
100 photos from this area
Area Information
Key information about the N1 2AL including its size, population, and administrative classification.
- Area Type
- Postcode
- Area Size
- 6951 m²
- Population
- 1861
- Population Density
- 12996 people/km²
House Prices in N1 2AL
44
Properties
£834,825
Average Sold Price
£58,000
Lowest Price
£1,205,000
Highest Price
Showing 44 properties
| Address | Type | Beds | Baths | Last Sale Price | Last Sale Date | |
|---|---|---|---|---|---|---|
| 20 Canonbury Square, London, N1 2AL | Flat | 4 | 3 | £927,000 | Jul 2023 | |
| 14 Canonbury Square, London, N1 2AL | Flat | 2 | 2 | £1,205,000 | Sep 2022 | |
| 18 Canonbury Square, London, N1 2AL | Maisonette | 3 | 2 | £1,152,500 | Apr 2017 | |
| 19 Canonbury Square, London, N1 2AL | Flat | 2 | 1 | £58,000 | Nov 2015 | |
| 22, 21-22 Canonbury Square, London, N1 2AL | Flat | 2 | - | £795,000 | Jul 2015 | |
| 30 Canonbury Square, London, N1 2AL | Flat | - | - | £820,000 | Apr 2015 | |
| 25 Canonbury Square, London, N1 2AL | Flat | - | - | £851,100 | Jun 2012 | |
| 23 Canonbury Square, London, N1 2AL | Terraced | 5 | 2 | £870,000 | Sep 1999 | |
| Flat A, 32 Canonbury Square, London, N1 2AL | Flat | 2 | 1 | - | - | |
| 20B Canonbury Square, London, N1 2AL | Flat | 2 | 1 | - | - |
Page 1 of 5
Energy Efficiency in N1 2AL
Amenities
Schools
| Rank | School | Type | Entry gender | Ages |
|---|
Explore more schools in this area
Go to Schools tabDemographics
Household Size
Two person
most common
Accommodation Type
Flats
most common
Tenure
36
majority
Ethnic Group
White
most common
Religion
N/A
most common
Household Composition
N/A
most common
Age
47
median
Adults (30-64 years)
most common
Household Deprivation
N/A
with no deprivation
NS-SEC
61
in Lower managerial occupations
Explore more demographic insights in this area
Go to Demographics tabPlanning
Planning Constraints
- Flood RiskPremium
- Ramsar Wetland SitesPremium
- Area of Outstanding Natural BeautyPremium
- Protected Nature ReservePremium
- Protected WoodlandPremium