Area Overview for EN1 2JR
Photos of EN1 2JR
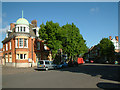
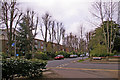
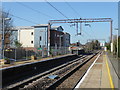
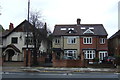
57 photos from this area
Area Information
Key information about the EN1 2JR including its size, population, and administrative classification.
- Area Type
- Postcode
- Area Size
- 6662 m²
- Population
- 1562
- Population Density
- 6403 people/km²
House Prices in EN1 2JR
18
Properties
£551,643
Average Sold Price
£167,000
Lowest Price
£875,000
Highest Price
Showing 18 properties
| Address | Type | Beds | Baths | Last Sale Price | Last Sale Date | |
|---|---|---|---|---|---|---|
| 19 Queen Annes Grove, Enfield, EN1 2JR | house | - | - | £690,000 | Aug 2018 | |
| 31 Queen Annes Grove, Enfield, EN1 2JR | Detached | 4 | 2 | £875,000 | Mar 2018 | |
| 26 Queen Annes Grove, Enfield, EN1 2JR | Semi-detached | 4 | 1 | £610,000 | Nov 2015 | |
| 25 Queen Annes Grove, Enfield, EN1 2JR | Semi-detached | 3 | 1 | £545,000 | Aug 2015 | |
| 24 Queen Annes Grove, Enfield, EN1 2JR | Semi-detached | - | - | £617,500 | Apr 2008 | |
| 27 Queen Annes Grove, Enfield, EN1 2JR | Terraced | - | - | £357,000 | May 2003 | |
| 34 Queen Annes Grove, Enfield, EN1 2JR | Semi-detached | - | - | £167,000 | May 1995 | |
| 23 Queen Annes Grove, Enfield, EN1 2JR | house | 3 | 1 | - | - | |
| 32-A-32-B Queen Annes Grove, Enfield, EN1 2JR | Flat | - | - | - | - | |
| 21 Queen Annes Grove, Enfield, EN1 2JR | Semi-detached | - | - | - | - |
Page 1 of 2
Energy Efficiency in EN1 2JR
Amenities
Schools
| Rank | School | Type | Entry gender | Ages |
|---|
Explore more schools in this area
Go to Schools tabDemographics
Household Size
Family (3-5 people)
most common
Accommodation Type
Houses
most common
Tenure
86
majority
Ethnic Group
White
most common
Religion
N/A
most common
Household Composition
N/A
most common
Age
47
median
Adults (30-64 years)
most common
Household Deprivation
N/A
with no deprivation
NS-SEC
35
in Lower managerial occupations
Explore more demographic insights in this area
Go to Demographics tabPlanning
Planning Constraints
- Flood RiskPremium
- Ramsar Wetland SitesPremium
- Area of Outstanding Natural BeautyPremium
- Protected Nature ReservePremium
- Protected WoodlandPremium