Area Overview for EN1 1PU
Photos of EN1 1PU


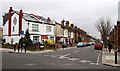
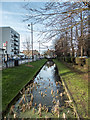
100 photos from this area
Area Information
Key information about the EN1 1PU including its size, population, and administrative classification.
- Area Type
- Postcode
- Area Size
- 1797 m²
- Population
- 1688
- Population Density
- 3021 people/km²
House Prices in EN1 1PU
10
Properties
£213,595
Average Sold Price
£117,500
Lowest Price
£375,000
Highest Price
Showing 10 properties
| Address | Type | Beds | Baths | Last Sale Price | Last Sale Date | |
|---|---|---|---|---|---|---|
| 8, Fotheringham Court, Fotheringham Road, Enfield, EN1 1PU | Flat | 2 | 1 | £375,000 | Jul 2022 | |
| 1, Fotheringham Court, Fotheringham Road, Enfield, EN1 1PU | Maisonette | - | - | £300,000 | Oct 2020 | |
| 6, Fotheringham Court, Fotheringham Road, Enfield, EN1 1PU | Maisonette | 2 | 1 | £280,000 | Mar 2016 | |
| 4, Fotheringham Court, Fotheringham Road, Enfield, EN1 1PU | Maisonette | 2 | 1 | £220,000 | Jul 2015 | |
| 3, Fotheringham Court, Fotheringham Road, Enfield, EN1 1PU | Flat | - | - | £193,000 | Jul 2014 | |
| 9, Fotheringham Court, Fotheringham Road, Enfield, EN1 1PU | Flat | - | - | £164,950 | Jun 2010 | |
| 2, Fotheringham Court, Fotheringham Road, Enfield, EN1 1PU | Maisonette | - | - | £169,000 | Dec 2009 | |
| 7, Fotheringham Court, Fotheringham Road, Enfield, EN1 1PU | Flat | - | - | £167,500 | May 2008 | |
| 5, Fotheringham Court, Fotheringham Road, Enfield, EN1 1PU | Maisonette | 1 | 1 | £117,500 | Mar 2005 | |
| 10, Fotheringham Court, Fotheringham Road, Enfield, EN1 1PU | Flat | 2 | - | £149,000 | Dec 2003 |
Energy Efficiency in EN1 1PU
Amenities
Schools
| Rank | School | Type | Entry gender | Ages |
|---|
Explore more schools in this area
Go to Schools tabDemographics
Household Size
Family (3-5 people)
most common
Accommodation Type
Houses
most common
Tenure
63
majority
Ethnic Group
White
most common
Religion
N/A
most common
Household Composition
N/A
most common
Age
47
median
Adults (30-64 years)
most common
Household Deprivation
N/A
with no deprivation
NS-SEC
34
in Lower managerial occupations
Explore more demographic insights in this area
Go to Demographics tabPlanning
Planning Constraints
- Flood RiskPremium
- Ramsar Wetland SitesPremium
- Area of Outstanding Natural BeautyPremium
- Protected Nature ReservePremium
- Protected WoodlandPremium