Area Overview for E9 6NG
Photos of E9 6NG
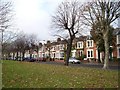
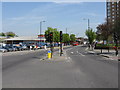
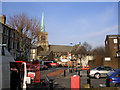
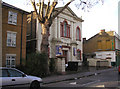
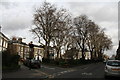
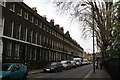
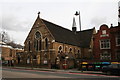
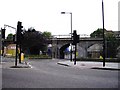
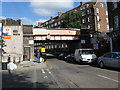
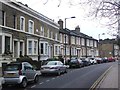
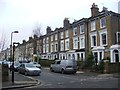
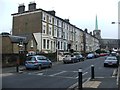
100 photos from this area
Area Information
Key information about the E9 6NG including its size, population, and administrative classification.
- Area Type
- Postcode
- Area Size
- 1.1 hectares
- Population
- 2666
- Population Density
- 15375 people/km²
House Prices in E9 6NG
75
Properties
£332,571
Average Sold Price
£71,000
Lowest Price
£700,000
Highest Price
Showing 75 properties
| Address | Type | Beds | Baths | Last Sale Price | Last Sale Date | |
|---|---|---|---|---|---|---|
| Flat A, 8 Belsham Street, Hackney, London, E9 6NG | Flat | 1 | 1 | £443,000 | Mar 2025 | |
| Flat D, 6 Belsham Street, Hackney, London, E9 6NG | Flat | - | - | £254,000 | Dec 2024 | |
| Ground Floor Unit, 2 Belsham Street, Hackney, London, E9 6NG | Flat | - | - | £700,000 | Aug 2022 | |
| Flat C, 4 Belsham Street, Hackney, London, E9 6NG | Flat | - | - | £350,000 | Feb 2022 | |
| Flat B, 4 Belsham Street, Hackney, London, E9 6NG | Flat | 1 | 1 | £400,000 | Jun 2020 | |
| Flat D, 8 Belsham Street, Hackney, London, E9 6NG | Flat | - | - | £110,000 | Nov 2003 | |
| Flat B, 8 Belsham Street, Hackney, London, E9 6NG | Flat | - | - | £71,000 | Jul 2002 | |
| Flat 3, 2 Belsham Street, Hackney, London, E9 6NG | Flat | 2 | 2 | - | - | |
| Flat 9, 2 Belsham Street, Hackney, London, E9 6NG | Flat | 1 | - | - | - | |
| Flat 2, 2 Belsham Street, Hackney, London, E9 6NG | Flat | 1 | 1 | - | - |
Page 1 of 8
Energy Efficiency in E9 6NG
Amenities
Schools
| Rank | School | Type | Entry gender | Ages |
|---|
Explore more schools in this area
Go to Schools tabDemographics
Household Size
One person
most common
Accommodation Type
Flats
most common
Tenure
21
majority
Ethnic Group
White
most common
Religion
N/A
most common
Household Composition
N/A
most common
Age
47
median
Adults (30-64 years)
most common
Household Deprivation
N/A
with no deprivation
NS-SEC
43
in Lower managerial occupations
Explore more demographic insights in this area
Go to Demographics tabPlanning
Planning Constraints
- Flood RiskPremium
- Ramsar Wetland SitesPremium
- Area of Outstanding Natural BeautyPremium
- Protected Nature ReservePremium
- Protected WoodlandPremium