Area Overview for E6 1NT
Photos of E6 1NT


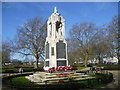
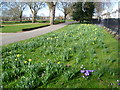
90 photos from this area
Area Information
Key information about the E6 1NT including its size, population, and administrative classification.
- Area Type
- Postcode
- Area Size
- 6773 m²
- Population
- Not available
- Population Density
- Not available
House Prices in E6 1NT
19
Properties
£238,499
Average Sold Price
£56,000
Lowest Price
£485,000
Highest Price
Showing 19 properties
| Address | Type | Beds | Baths | Last Sale Price | Last Sale Date | |
|---|---|---|---|---|---|---|
| 20 Hartley Avenue, East Ham, London, E6 1NT | Flat | - | - | £298,000 | Mar 2023 | |
| 2 Hartley Avenue, East Ham, London, E6 1NT | Terraced | 3 | 2 | £485,000 | Nov 2021 | |
| 4 Hartley Avenue, East Ham, London, E6 1NT | house | 3 | 1 | £390,000 | Jun 2018 | |
| 18 Hartley Avenue, East Ham, London, E6 1NT | house | - | - | £300,000 | Apr 2015 | |
| 14 Hartley Avenue, East Ham, London, E6 1NT | Terraced | - | - | £250,000 | Mar 2006 | |
| 8 Hartley Avenue, East Ham, London, E6 1NT | Terraced | 3 | 2 | £67,000 | Sep 1998 | |
| 16 Hartley Avenue, East Ham, London, E6 1NT | house | - | - | £61,995 | Dec 1997 | |
| 6 Hartley Avenue, East Ham, London, E6 1NT | Terraced | - | - | £56,000 | Oct 1997 | |
| First Floor Flat, 12 Hartley Avenue, East Ham, London, E6 1NT | undefined | - | - | - | - | |
| 12A Hartley Avenue, East Ham, London, E6 1NT | undefined | - | - | - | - |
Page 1 of 2
Energy Efficiency in E6 1NT
Amenities
Schools
| Rank | School | Type | Entry gender | Ages |
|---|
Explore more schools in this area
Go to Schools tabDemographics
Household Size
Family (3-5 people)
most common
Accommodation Type
Houses
most common
Tenure
42
majority
Ethnic Group
asian_total
most common
Religion
N/A
most common
Household Composition
N/A
most common
Age
47
median
Adults (30-64 years)
most common
Household Deprivation
N/A
with no deprivation
NS-SEC
18
in Lower managerial occupations
Explore more demographic insights in this area
Go to Demographics tabPlanning
Planning Constraints
- Flood RiskPremium
- Ramsar Wetland SitesPremium
- Area of Outstanding Natural BeautyPremium
- Protected Nature ReservePremium
- Protected WoodlandPremium