Area Overview for E3 5EL
Photos of E3 5EL
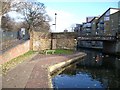
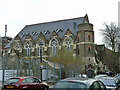
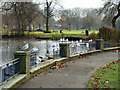
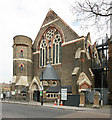
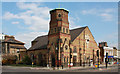
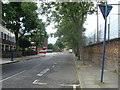
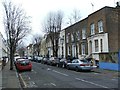
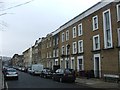
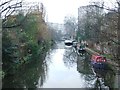
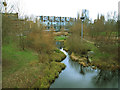
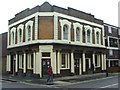
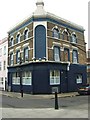
100 photos from this area
Area Information
Key information about the E3 5EL including its size, population, and administrative classification.
- Area Type
- Postcode
- Area Size
- 6661 m²
- Population
- 2730
- Population Density
- 19754 people/km²
House Prices in E3 5EL
34
Properties
£240,513
Average Sold Price
£168,050
Lowest Price
£375,000
Highest Price
Showing 34 properties
| Address | Type | Beds | Baths | Last Sale Price | Last Sale Date | |
|---|---|---|---|---|---|---|
| 597B Roman Road, London, E3 5EL | Flat | - | - | £375,000 | Oct 2022 | |
| Flat 1, 515 Roman Road, London, E3 5EL | Flat | - | - | £190,000 | Nov 2008 | |
| 597A Roman Road, London, E3 5EL | Flat | 2 | 1 | £229,000 | Aug 2008 | |
| 543A Roman Road, London, E3 5EL | Flat | 1 | 1 | £168,050 | Jan 2006 | |
| Flat 6, 519A Roman Road, London, E3 5EL | Flat | 2 | 1 | - | - | |
| Flat 1, 519A Roman Road, London, E3 5EL | Flat | 3 | 2 | - | - | |
| 587B Roman Road, London, E3 5EL | Flat | 2 | 1 | - | - | |
| Flat 4, 519A Roman Road, London, E3 5EL | Flat | 2 | - | - | - | |
| Flat 2, 519A Roman Road, London, E3 5EL | Flat | 1 | - | - | - | |
| Flat A, 567 Roman Road, London, E3 5EL | Maisonette | 2 | 1 | - | - |
Page 1 of 4
Energy Efficiency in E3 5EL
Amenities
Schools
| Rank | School | Type | Entry gender | Ages |
|---|
Explore more schools in this area
Go to Schools tabDemographics
Household Size
One person
most common
Accommodation Type
Flats
most common
Tenure
19
majority
Ethnic Group
White
most common
Religion
N/A
most common
Household Composition
N/A
most common
Age
47
median
Adults (30-64 years)
most common
Household Deprivation
N/A
with no deprivation
NS-SEC
30
in Lower managerial occupations
Explore more demographic insights in this area
Go to Demographics tabPlanning
Planning Constraints
- Flood RiskPremium
- Ramsar Wetland SitesPremium
- Area of Outstanding Natural BeautyPremium
- Protected Nature ReservePremium
- Protected WoodlandPremium