Area Overview for E3 4SL
Photos of E3 4SL
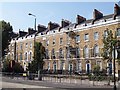
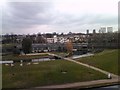
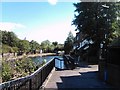
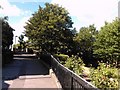


100 photos from this area
Area Information
Key information about the E3 4SL including its size, population, and administrative classification.
- Area Type
- Postcode
- Area Size
- 6272 m²
- Population
- 1391
- Population Density
- 15789 people/km²
House Prices in E3 4SL
55
Properties
£563,750
Average Sold Price
£475,000
Lowest Price
£630,000
Highest Price
Showing 55 properties
| Address | Type | Beds | Baths | Last Sale Price | Last Sale Date | |
|---|---|---|---|---|---|---|
| 83 St Clements Avenue, London, E3 4SL | Flat | - | - | £630,000 | Jan 2023 | |
| 79 St Clements Avenue, London, E3 4SL | Flat | - | - | £615,000 | Apr 2022 | |
| Apartment G06, Clock Tower Apartments, 41 St Clements Avenue, London, E3 4SL | Flat | - | - | £535,000 | Dec 2019 | |
| Apartment G04, Clock Tower Apartments, 41 St Clements Avenue, London, E3 4SL | Flat | - | - | £475,000 | Dec 2019 | |
| Apartment 102, Arcus Apartments, 39 St Clements Avenue, London, E3 4SL | Flat | 2 | 2 | - | - | |
| Apartment 101, Arcus Apartments, 39 St Clements Avenue, London, E3 4SL | Flat | 1 | 1 | - | - | |
| Apartment 102, Clock Tower Apartments, 41 St Clements Avenue, London, E3 4SL | Flat | 1 | 1 | - | - | |
| Apartment G01, Bodkin Apartments, 61 St Clements Avenue, London, E3 4SL | Flat | 2 | 2 | - | - | |
| Apartment G01, Arcus Apartments, 39 St Clements Avenue, London, E3 4SL | Flat | 2 | 3 | - | - | |
| Apartment 201, Clock Tower Apartments, 41 St Clements Avenue, London, E3 4SL | Flat | - | - | - | - |
Page 1 of 6
Energy Efficiency in E3 4SL
Amenities
Schools
| Rank | School | Type | Entry gender | Ages |
|---|
Explore more schools in this area
Go to Schools tabDemographics
Household Size
Two person
most common
Accommodation Type
Flats
most common
Tenure
37
majority
Ethnic Group
White
most common
Religion
N/A
most common
Household Composition
N/A
most common
Age
47
median
Adults (30-64 years)
most common
Household Deprivation
N/A
with no deprivation
NS-SEC
45
in Lower managerial occupations
Explore more demographic insights in this area
Go to Demographics tabPlanning
Planning Constraints
- Flood RiskPremium
- Ramsar Wetland SitesPremium
- Area of Outstanding Natural BeautyPremium
- Protected Nature ReservePremium
- Protected WoodlandPremium