Area Overview for E16 3PU
Photos of E16 3PU
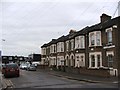
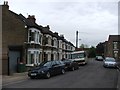

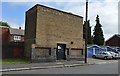
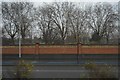
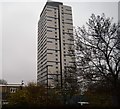
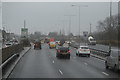
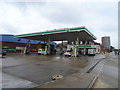
81 photos from this area
Area Information
Key information about the E16 3PU including its size, population, and administrative classification.
- Area Type
- Postcode
- Area Size
- 3275 m²
- Population
- 1980
- Population Density
- 15349 people/km²
House Prices in E16 3PU
25
Properties
£179,364
Average Sold Price
£33,000
Lowest Price
£335,000
Highest Price
Showing 25 properties
| Address | Type | Beds | Baths | Last Sale Price | Last Sale Date | |
|---|---|---|---|---|---|---|
| 59 Sark Walk, Canning Town, London, E16 3PU | Maisonette | 2 | 1 | £243,000 | Sep 2025 | |
| 39 Sark Walk, Canning Town, London, E16 3PU | Maisonette | 3 | 1 | £335,000 | Jul 2016 | |
| 55 Sark Walk, Canning Town, London, E16 3PU | Maisonette | - | - | £260,000 | Mar 2016 | |
| 77 Sark Walk, Canning Town, London, E16 3PU | house | - | - | £335,000 | Jun 2014 | |
| 57 Sark Walk, Canning Town, London, E16 3PU | Maisonette | - | - | £145,000 | Sep 2013 | |
| 51 Sark Walk, Canning Town, London, E16 3PU | house | - | - | £167,000 | May 2006 | |
| 75 Sark Walk, Canning Town, London, E16 3PU | Terraced | 5 | 3 | £185,000 | May 2004 | |
| 69 Sark Walk, Canning Town, London, E16 3PU | Maisonette | 2 | 1 | £112,500 | May 2002 | |
| 35 Sark Walk, Canning Town, London, E16 3PU | Maisonette | 3 | 1 | £110,000 | May 2002 | |
| 63 Sark Walk, Canning Town, London, E16 3PU | Maisonette | 2 | 1 | £47,500 | Sep 1999 |
Page 1 of 3
Energy Efficiency in E16 3PU
Amenities
Schools
| Rank | School | Type | Entry gender | Ages |
|---|
Explore more schools in this area
Go to Schools tabDemographics
Household Size
Family (3-5 people)
most common
Accommodation Type
Houses
most common
Tenure
32
majority
Ethnic Group
White
most common
Religion
N/A
most common
Household Composition
N/A
most common
Age
47
median
Adults (30-64 years)
most common
Household Deprivation
N/A
with no deprivation
NS-SEC
21
in Lower managerial occupations
Explore more demographic insights in this area
Go to Demographics tabPlanning
Planning Constraints
- Flood RiskPremium
- Ramsar Wetland SitesPremium
- Area of Outstanding Natural BeautyPremium
- Protected Nature ReservePremium
- Protected WoodlandPremium